
Business
simulation
guide
simulation
guide
Chocolate factory
advanced version
| [[page_cu]]/[[page_nb]] |
Have you ever wondered how it is to run your own chocolate factory? The "Chocolate Factory" business simulation will allow you to be an entrepreneur running this business. Your task will be to plan an offer for your company, and then equip it with necessary workstations and equipment, employ appropriate staff and secure the resources needed to sell planned products. To attract customers, you will need carefully selected advertising in traditional media as well as on the Internet. Then, just fix the prices and start selling!
Your company will operate on the market together with other companies created by other participants of the simulation. You will compete for customers, among others, with the quality of your products and price. Your decisions will affect the results of your competitors and vice versa. If your competitors lower the price, they will attract more customers. And if you increase the quality of your products, you can expect that more customers will come to you.
The simulation has a tour-based (round-based) structure. One round of the business activity corresponds to one month. You will be running the company for 12 months. It is important to pay attention to the months, because some products are seasonal and you have to prepare for the months when the accumulation of e.g. hot chocolate spoons occurs.
After each round (month) you will receive the results of your decisions. They will show in detail what happened in the previous month, including how many customers came to you, how many of them you managed to serve, your revenues and expenses, your account balance, etc. Those results need to be carefully analysed to make changes for the next month. For example, if for a given product you have fewer customers than you planned, you may need to lower the price or work on improving the quality.
The game has the following tabs:
Most of the tabs are divided into the Decisions and Results section.
The Decisions tab contains all the issues that you need to decide on in a given round. To make decisions use the information in the Results tab, which contains a summary of the most important things that happened in the previous month.
The financial statement tab presents only results. You will not take any decisions here.
This guide will take you through all the decisions you need to make in the simulation. All explanations will be accompanied with calculation examples to illustrate the situations and help you understand the decisions you need to take better.
In each round you can view the decisions you took in the previous rounds. You cannot change them, of course, but you can check, e.g. the prices of your products, the number of ordered resources, etc.

|
To view the decisions from previous rounds, use the buttons next to the name of the month. |

If you need more information on certain data, results or decisions, you can use available tips and extra materials:
The aim of the first round is to organize your business. At the beginning you need to specify the name of your company and its mission statement. If you run the company with partners, you will need to determine what the principles of joint decision-making will be and to share responsibility for particular aspects of your business.
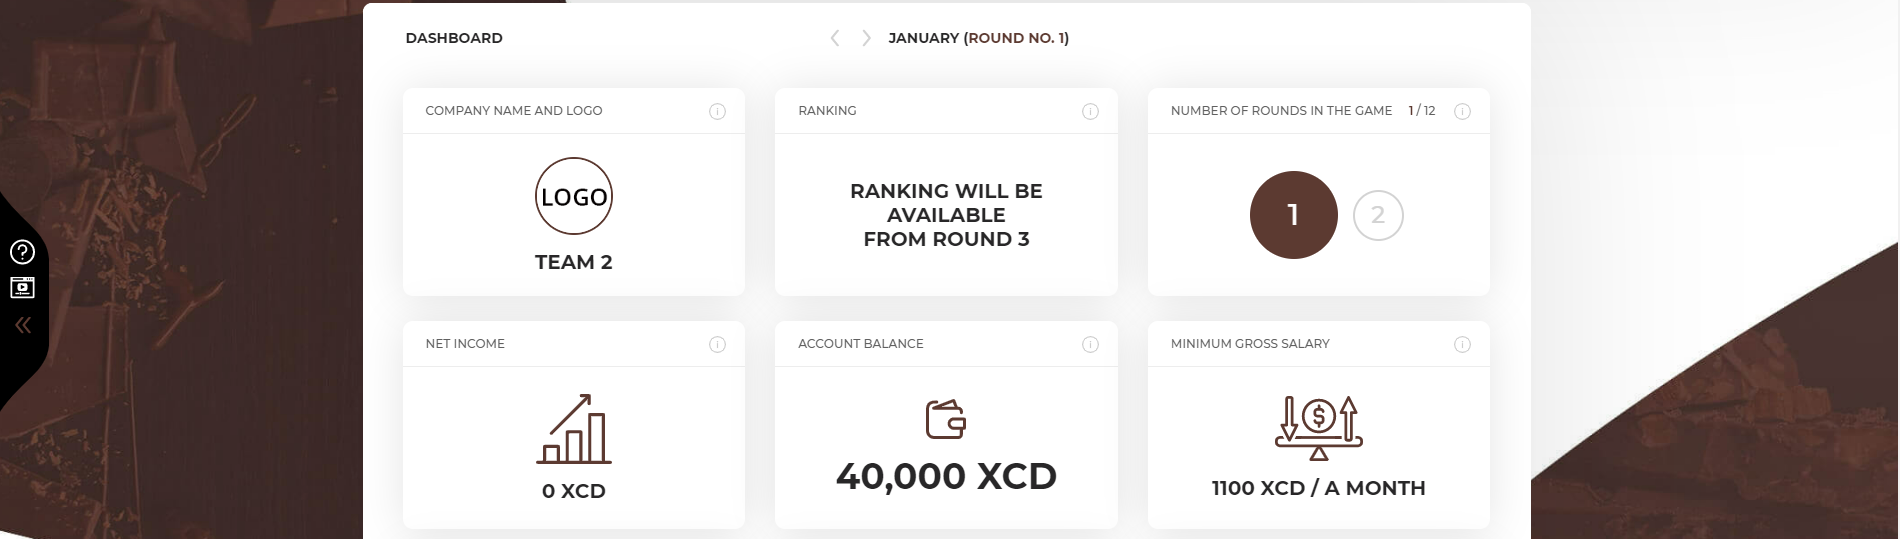
You have collected the amount of EUR 40,000 to start your business. Those funds will allow you to spread your wings at the initial stage of your activity, but remember that you should start generating the revenues as soon as possible to use them to finance your current operations.

|
The purpose of the first round is to organize the company, make plans for future rounds and make investments. You will not be selling your products yet. Your task is to plan your offer and future employment to prepare the workstations for your future employees. |
|
|
Decisions from Round 1 are not evaluated in the simulation. |
Check your mailbox at the beginning of every month. You can expect to receive mails from your business mentor, government agencies, media etc. Your task is to assess if the information has some real influence on your business and draw conclusions regarding proper reaction.

Choose the name for your company. This will be the name you will use throughout the duration of the simulation, so try to make it stand out from the competition. You can also add a company logo to graphically present your company. As an aid, the names of other chocolate factories that operate on the market are given.
|
|
To add the company name, enter your name in the white box in place of the inscription 'Team ...' and click 'Save'. By clicking on the 'Company logo' picture, you can add any picture from your computer disk as your company's logo. |

The company's mission statement determines the purpose of its existence on the market and the role of the organization in the wider environment. Familiarize yourself with the examples of missions of various companies and prepare your own mission which will determine the direction of the entire organization, the concept of business, its role and sense of existence.
|
|
To add the company’s mission, enter the mission content in the white box and click 'Save'. |
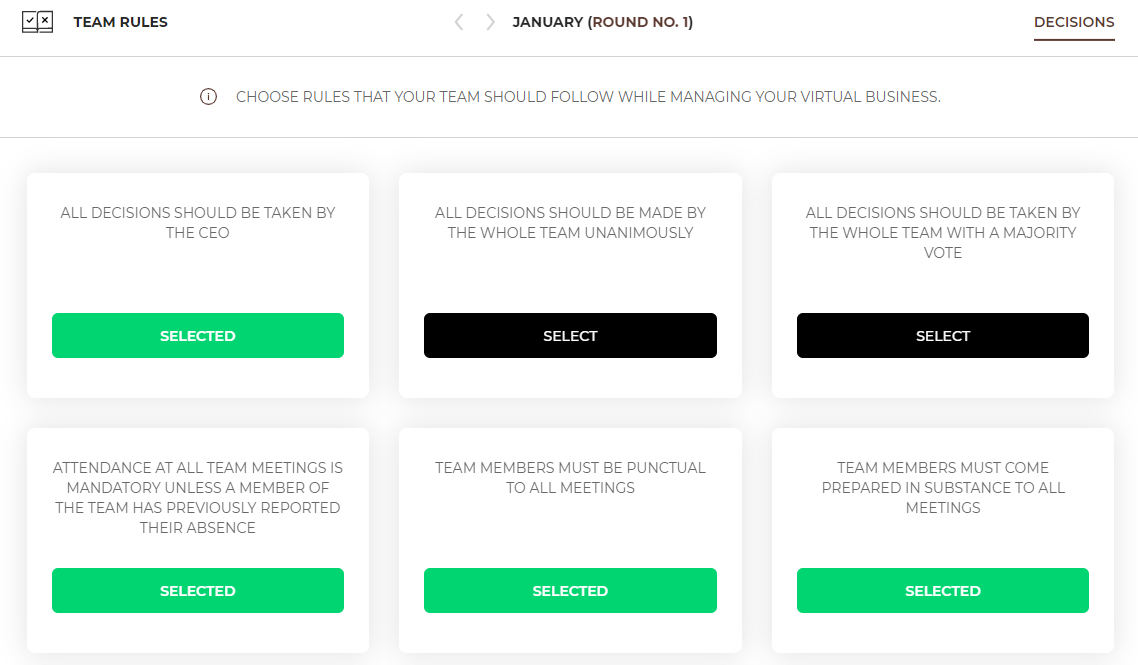
If you run your company together with partners, you must commonly agree on the rules of your team operation. Specify at the beginning how key decisions will be taken, what you expect from yourself and how you want to organize your work.
|
|
Choose the team's rules you want to be followed in your team. You can choose any number of rules. |
Managing a company requires taking decisions and monitoring results in various areas of activity such as marketing, finance, investments, supplies, etc. As a team, you will certainly have different competences and interests, so take them into account when sharing responsibility for specific areas. You can choose any number of roles for each team member. Not all of them have to be used. The choice of roles does not affect the results of the game.
|
|
Select the role/roles for each team member from the list provided. |
To successfully run a business, make sure to see the big picture i.e. where the money comes from and goes to, what your customers want, what the crucial resources and processes are as well as the relationships you need to nurture because they are key to your business. A visual representation of this big picture is called business model canvas.
Drag and drop all the elements from the left hand side to the right parts of the business canvas model. When you are ready, check if they were categorized properly using the “Verify your answers” button.
Start making decisions regarding your company from planning the products you want to offer to your customers. In the first round, you can choose 3 basic products, and their range will be expandable in each subsequent round.
|
|
You are not going to sell your products in the first round. The aim of the first round is to make plans and invest. Your task is to estimate the demand for your products in round 2. This number will be the base to calculate how many employees you will need. That is how you will know how many workstations you have to prepare. |
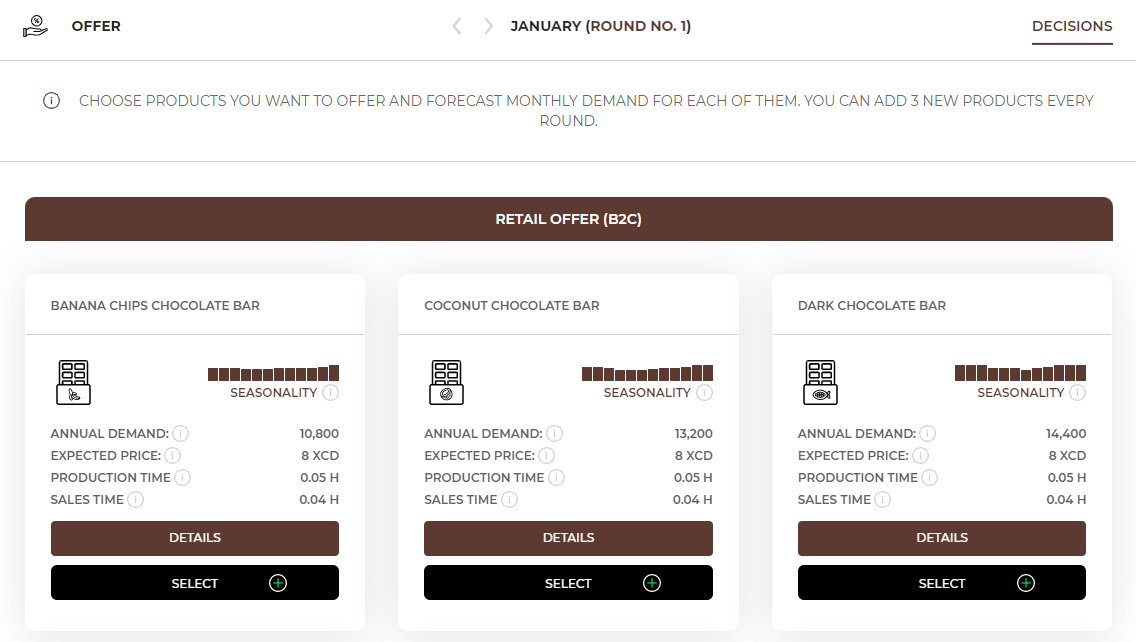
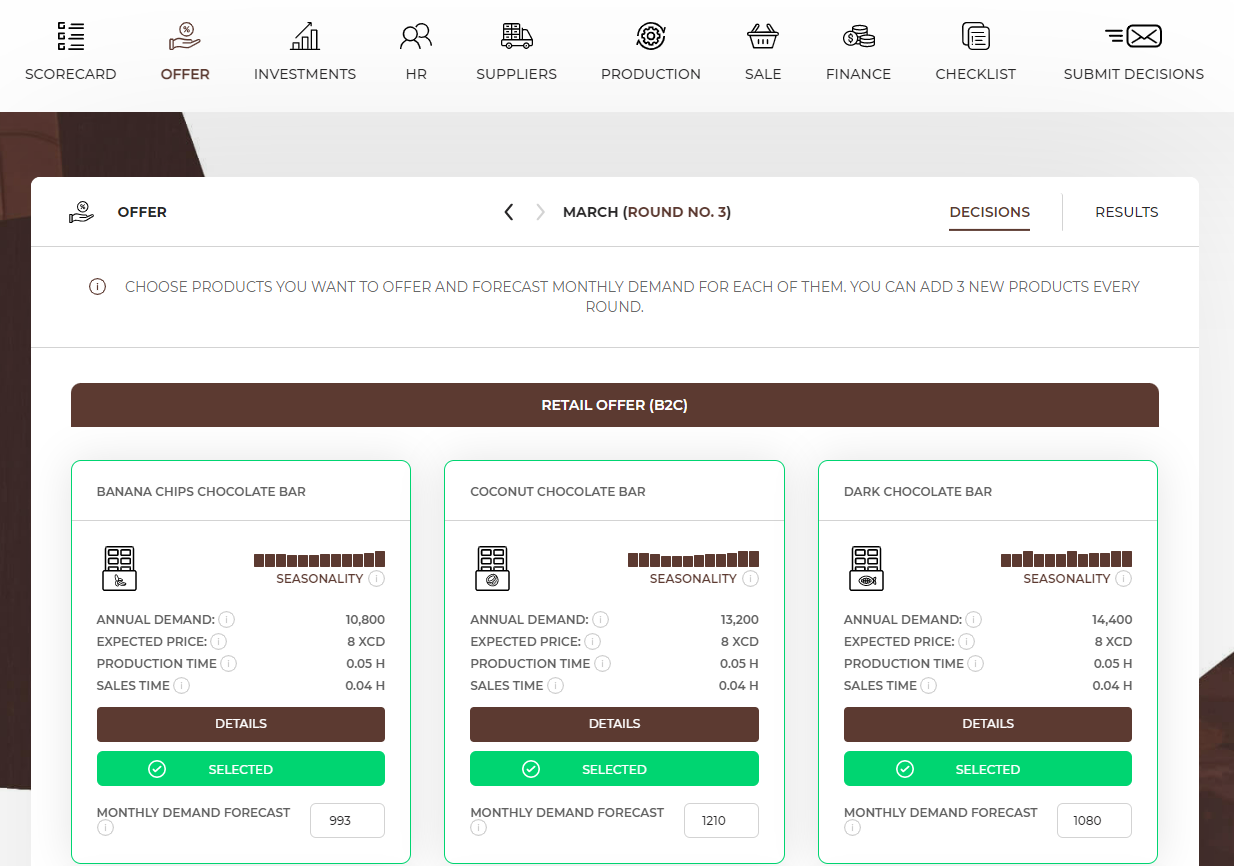
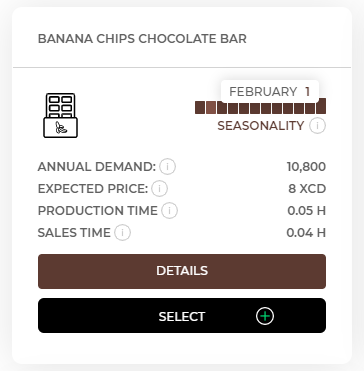
In the Offer tab, you will find a list of products that are available to you at that time. The products differ from each other in terms of annual demand, i.e. the number of products customers are willing to buy during the year, seasonality, production and sales time, required equipment, employees and resources.

|
Example |
|

|
Forecasted number of products in month X |
= | annual demand (from the Offer tab) |
/ | 12 | * | seasonality ratio in month X (from the chart) |
10,800 (annual demand) / 12 x 1 (seasonality in February) = 900 (demand forecast for banana chips chocolate bars in February)
The expected price on the market for this product is 8XCD, which means that customers expect a price oscillating around this amount. You can set your price as a higher or a lower one. However, remember that a high price should be followed by high quality that justifies a higher price. On the other hand, be careful with lowering the price as it may cause you to suffer losses on a given product. You should also regularly compare your prices with your competitors.
Production time shows the time needed to produce 1 piece od the product. In this case you need an average of 0,05 hour of production time to produce 1 banana chips chocolate bar.
Sales time shows the time needed to sell 1 piece of the product to a customer. In this case you need an average of 0,04 hour of sales time to sell 1 banana chips chocolate bar.
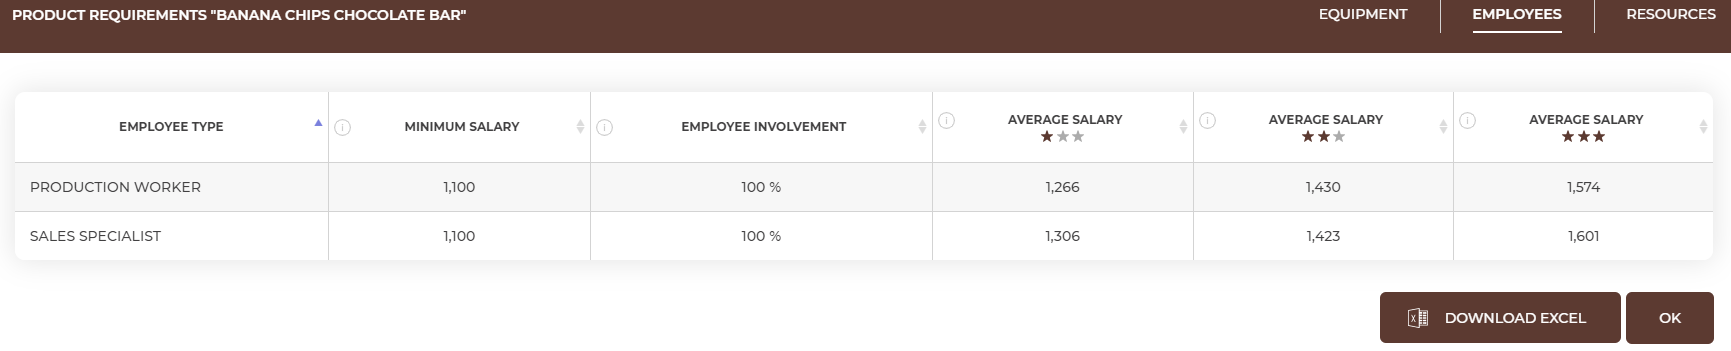
After entering „Details” you will have access to the information on everything you need to manufacture and sell the product (equipment, employees, resources).

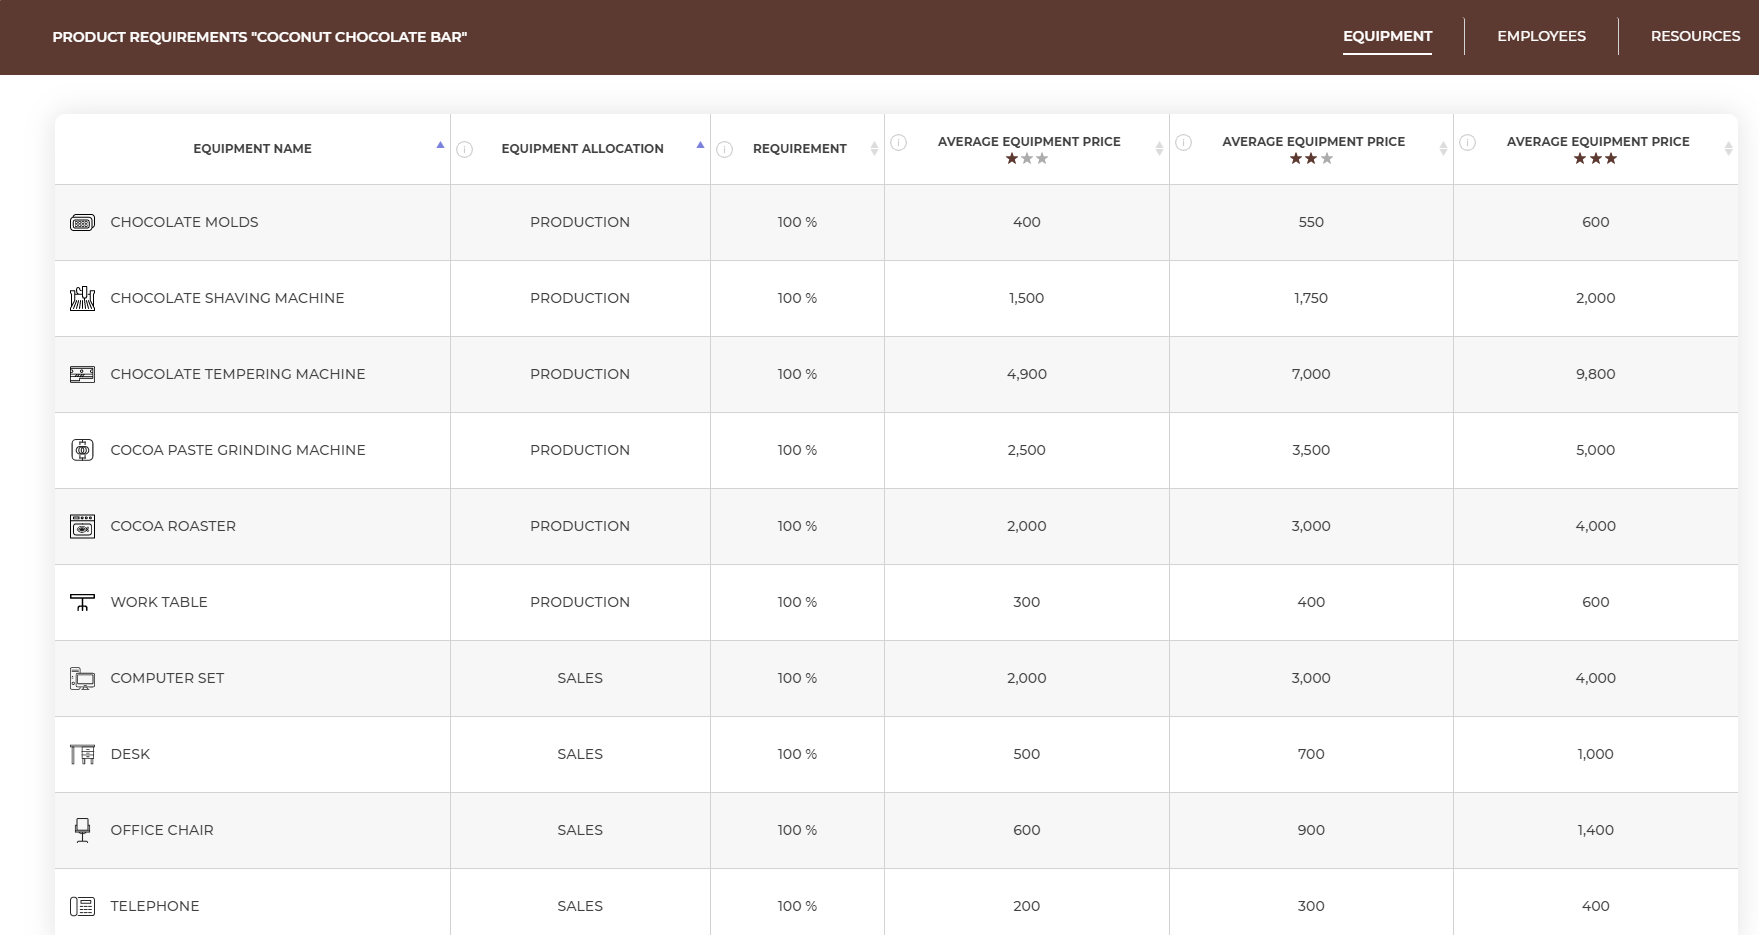
Equipment. To offer banana chips chocolate bar, you need the equipment that allows you to produce chocolate bars (that is chocolate molds, a chocolate shaving machine, a chocolate tempering machine, a cocoa paste grinding machine, a cocoa roaster and a work table) and then sell them (a computer set, a desk, an office chair and a computer set). In the Equipment Allocation column you can find the information if the equipment is needed for producing or for selling the product. Then you will be able to check for which workstation you should buy a particular piece of equipment. The Requirement column tells you how long each of these equipment is needed during the process of producing and selling the bars. If the equipment has a requirement equal 100%, it means that it is not possible for employees to share this piece of equipment and you need to buy a new piece for every new workstation. Each piece of equipment is offered by manufacturers on three levels of quality - basic (☆), standard (☆☆) and premium (☆☆☆). The higher the quality, the higher the price of the equipment, but your employees are more satisfied working on high quality, i.e. more ergonomic and reliable equipment. Each piece of equipment may, in addition to the purchase costs, also generate monthly costs. Information on all the costs of equipment can be found in the Equipment tab (after clicking 'Buy Equipment' button).
Employees. To offer banana chips chocolate bar, you need to hire 2 employees. The first one is the production worker and the second one is the sales specialist. In the employees tab you can find what is the minimum salary of the employees, their involvement, and the average salary on the market depending on the employee's experience (e.g. junior (☆), senior (☆☆), expert (☆☆☆).
Resources. To offer banana chips chocolate bar, you need 5 types of resources – banana bites, chocolate wrappers, cocoa beans, cocoa butter and sugar. The table shows average prices of the required resources, depending on their quality. Remember that the exact prices can be found in the Suppliers tab.
|
|
In the first round you can choose only 3 products for your offer. In each subsequent round, you can add any three products to the range of products included in your offer. |
|
|
If you decide to choose a product, press the “select” button. Then enter the forecasted monthly demand (the number of products you want to offer to your customers during a month based on the annual demand and seasonality) calculated using the formula below. Do the same for all products that you want to sell. |
|
|
Forecasted number of products in month X |
= | annual demand (from the Offer tab) |
/ | 12 | * | seasonality ratio in month X (from the chart) |
Every employee needs their place to work. When employing new employees, remember to provide them with a workstation. Later, you need to equip them with proper equipment required to sell selected products.
You need to assess how many employees you will need to decide how many workstations to buy. Remember that you need 1 individual workstation for each employee.
Start with checking which type of employee you will need to produce and sell a given product. You can check it in the Offer tab, after entering the details of a given product.
Knowing which employees you need, you will have to count how many people you need to employ. This number depends on the number of products you want to have in your offer and on the time needed to produce and sell 1 product. To calculate the number of employees you need, you must calculate the sales and production time that you will need to prepare and sell all scheduled products.
|
Production time needed to manufacture all products = forecasted demand for product 1 x production time needed to manufacture product 1 + forecasted demand for product 2 x production time needed to manufacture product 2 + ............ |
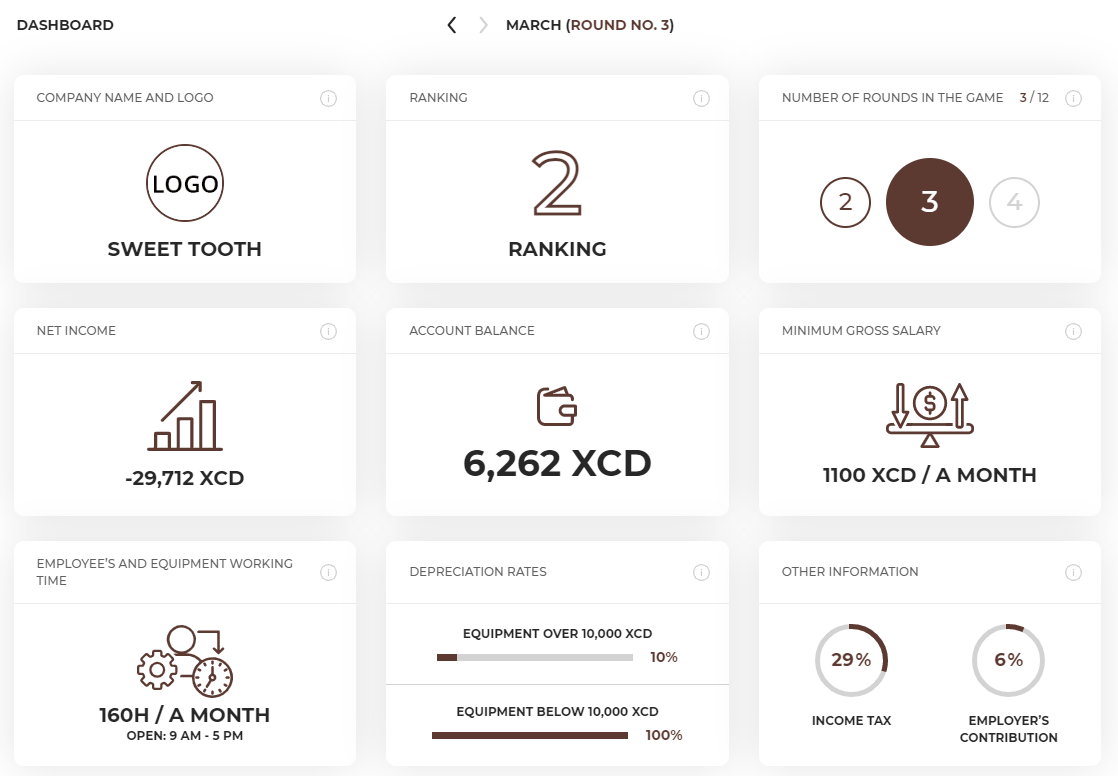
You also need to know the real working time of your employees, in other words, what their processing capacity is. We assume that every employee works 8 hours a day, 20 days a month, on average. Therefore, the monthly processing capacity of your employees is 160 hours (this information is also available on the dashboard screen).
|
|
Number of employees |
= |
production time needed to manufacture all planned products |
/ |
the employee's monthly working time (processing capacity) |
If you obtain as a result an integer, e.g. 2, the matter is simple - you will need 2 employees. However, what to do when you obtain a decimal fraction, e.g. 1.5? Should you employ 1 or 2 employees? If you hire only one employee, they will not manufacture all expected products, because they will run out of time. If you hire two employees, part of their working time will not be used, but at least you will manufacture all expected products and will not lose customers due to a lack of products. Round up the obtained result to employ the number of employees needed to manufacture all expected products.
Once you know how many production employees you need, calculate the number of sales employess you need in the same way.
|
|
Example |
You need to check how much time it will take to manufacture 1 product of each kind:
1. Banana chips chocolate bar – 0,05 hour (h)
The total number of hours needed to produce all planned chocolate bars is:
| 900 bars x 0,05 h | + | 1210 bars x 0,05 h | + | 1080 bars x 0,05 h | = | 159,5 h |
 |
|
|
||||
| Banana chips chocolate bars | Coconut chocolate bars | Dark chocolate bars |
| 900 bars x 0,04 h | + | 1210 bars x 0,04 h | + | 1080 bars x 0,04 h | = | 127,6 h |
|
|
|
||||
| Banana chips chocolate bar | Coconut chocolate bar | Dark chocolate bar |
|
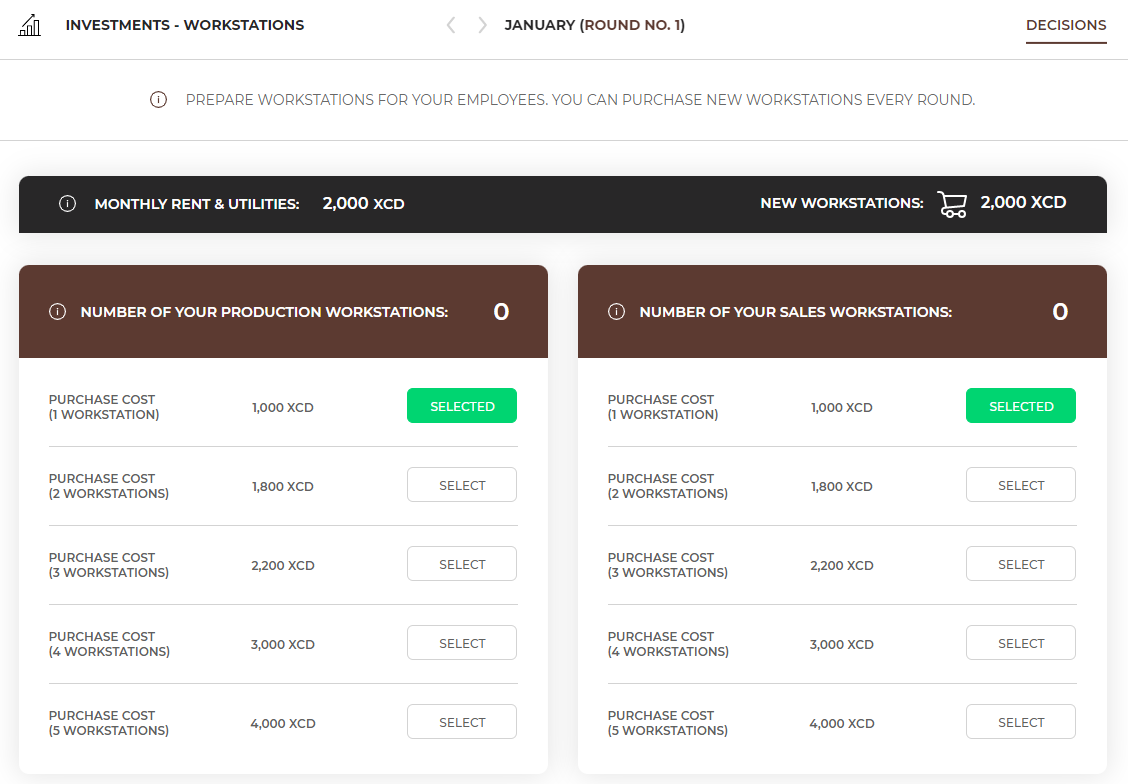
You can buy any number of workstations each round. You do not have to equip them immediately, and you can start using them once you need to hire more people. Until then, they will be empty. They will not generate any additional costs.
|
|
The workstations must be prepared one round ahead. This means that if you want to have a workstation available next month, you must buy it in the current month. |
Additionally, remember that workstations generate costs e.g. rent, media that you need to pay every month. Monthly rent and utilities cost do not depend on the number of workstations.
Your company needs a bank account with which you will be able to settle all expenses. You can choose between several banks - the offer differs in fees for the account keeping and interest rates on deposits, loans and credits.
 |
The monnthly bank fees are the monthly costs of keeping an account at a given bank. The credit card feeis the monthly cost for holding a payment card of a given bank. The interest rate on deposit shows the bank's offer related to investing funds in deposits. The interest rate is given on an annual basis. The interest rate on emergency loan shows the bank's offer related to granting loans for unplanned expenses. The interest rate is given on an annual basis. The interest rate on credit shows the bank's offer related to granting a credit. The interest rate is given on an annual basis. |
|
To choose a bank, press the “select” button under the selected bank. You can select only one bank. You will be able to change the bank in the next rounds. |
You hire an accounting office to keep your company's books. The accounting office will be taking care of processing all invoices, preparing contracts and bills for your employees, as well as preparing the financial statement. When choosing an accounting office, pay attention to the costs you will be incurring. The fee for the accounting office includes 2 elements. The first is a document booking fee. One document is, for example, one invoice from a supplier, an employee’s remuneration or a sales report of a specific products (sales to an individual customer is not a separate document - revenues from each products are booked collectively as one document). The second part is the employees fee for serving contracts concluded by the company with employees. Depending on the type of contract under which you plan to hire employees and on the number of employees you hire, you can forecast the costs related to the accounting office’s services and choose the best one.
|
To choose an accounting office, press the “select” button under the selected office. You can select only one office. In each round you can change the decision and choose a different offer. |
Your business will be exposed to various unexpected events and situations. Machines may break unexpectedly, deliveries may be delayed, hurricanes or other natural disasters may hit your area. The scope may be wide, but the result is usually the same. You will bear extra costs. Fortunately, you can insure your business against at least some of them. If you do, should any of the risks appear and you suffer exceptional costs, the insurance company will compensate for them.
In this section, you will find the available insurance options covering different risks. Next to each option, you will find the probability of appearance as well as potential costs of the damages. Select the types of risks you would like to be insured against. You can change the scope of risks you are insured against every round.
The checklist will help you to verify if all the most important decisions have been made. The checklist includes three types of warnings - red, blue and yellow.

Red warning shows that some important decision is missing and you should correct it. Yellow and blue are informational and their task is to draw your attention to aspects where no decisions were made and you should check if that was your intention or whether the given values are correct.
|
To check or correct decisions indicated in the warnings on the error list, use the 'Correct' button on the right-hand side of the message or go to the appropriate tab in the top menu. |
By pressing the ‘Submit decisions’ button you will send information to your Instructor that your team has taken all the decisions in a given round and you are ready for the simulation to be moved to the next round. It is possible to return to the game until the game is advanced to the next round by the Instructor. You can do that by using the ‘Return to making decisions in the current round’ button.
If you are playing in a solo game, submitting decision will take you directly to the next round.
In the first round, you have already made a decision regarding the initial offer, i.e. a portfolio of products that you want to offer to your customers. In round 2, all the required resources, equipment and employees should be purchased and you can start selling your offer. In round 2 there are the following new elements: Investment - equipment, HR - employment, Suppliers and Sales.
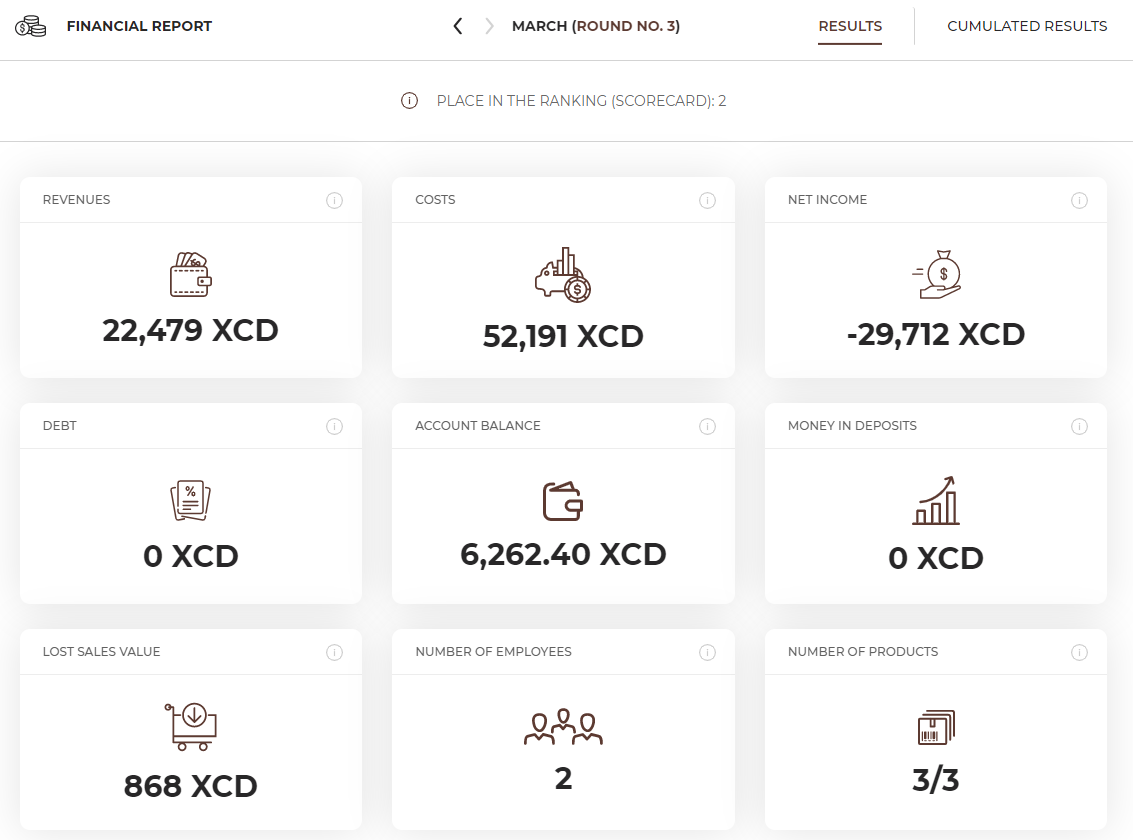
At the beginning of each round you will receive two pieces of information: a summary in the form of a report, which shows the most important results from the previous round and a reminder of the following relevant amounts:
|
|
You can return to the report at any time by clicking on the game logo in the left corner of the top menu. |
You will receive the summary of your key results in the form of financial report. You have 2 tabs available in the report – results (from the previous round) and cumulative results (all rounds played so far).
After every month is over, your accounting office will prepare a financial statement for the given month. It will consist of a profit & loss account (P&L), balance sheet and cash flow statement.
This information will help you analyse the financial side of your business – revenues, costs and the flows of cash.
In the Finance – Bank tab you can check your finances and see how your bank account balance changed after every operation. You can see details of all revenues for particular products and single costs here.
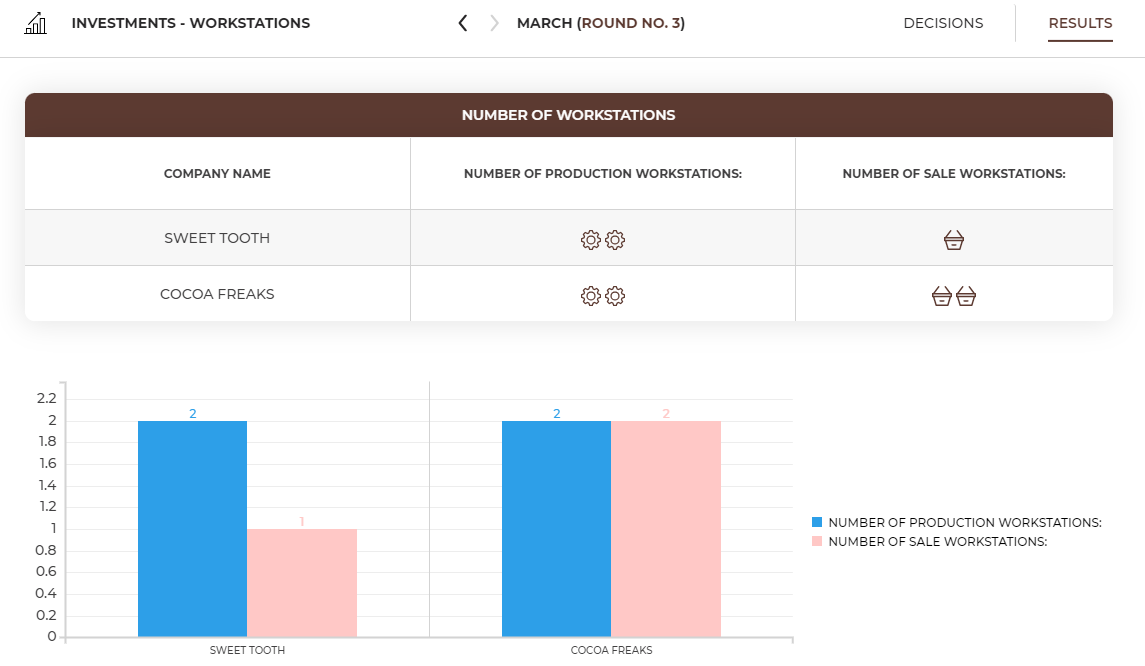
In the Investments – Workstation tab, in the Results card, you can check the number of workstations purchased by all teams.
In round 2 you start manufacturing and selling your products. Prepare all the required resources, equipment and hire enough employees to serve your forecasted customers. Make decisions step by step in the top menu going from left to right.
|
|
The aim of round 2 is to prepare products for sale. Your offer is ready for sale after all products you selected in the Offer tab appear in the Sale tab and you set their prices. |
You already prepared the demand forecast for February in round 1. So now just make sure that all products you want to sell are selected and the demand forecast is calculated for each of them.
|
|
In round 2 you can only sell first 3 products. You will be able to add more products to your portfolio in the subsequent rounds. |
In the 'Workstations' section you will find information on the number of workstations currently held in the company and you will be able to buy more of them. The number of workstations held is shown in the Workstations tab.
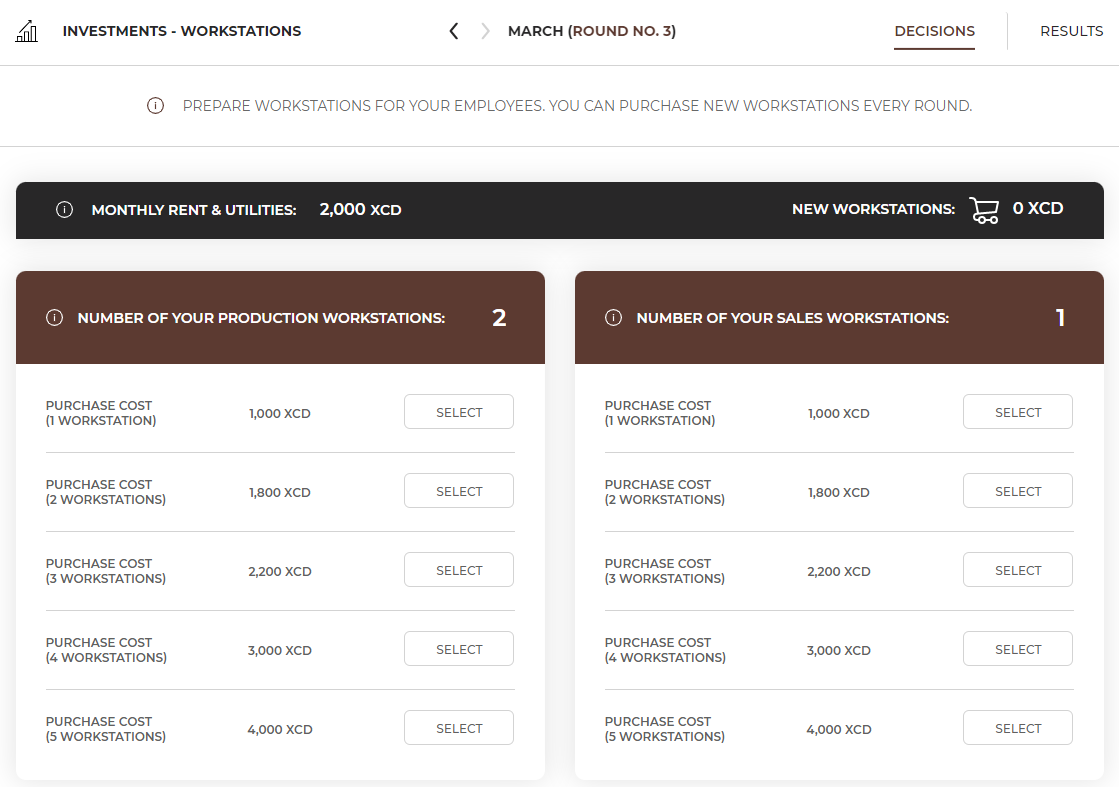
If you need an extra workstation, choose the number of new workstations you need. Remember that workstations purchased in previous rounds are still available and you just need to prepare the extra ones.
|
|
Preparation of workstations lasts 1 round (month), so you must remember to prepare them in advance. For example, if you buy a workstation in February you will be able to hire an employee and buy equipment in March. |
After preparing the workstations, you will need to equip them properly. The kind of equipment you will need to buy depends on what products you want to sell.
|
|
Remember that the Offer tab only shows you the requirements and you purchase the equipment in the Investments – Equipment tab. |
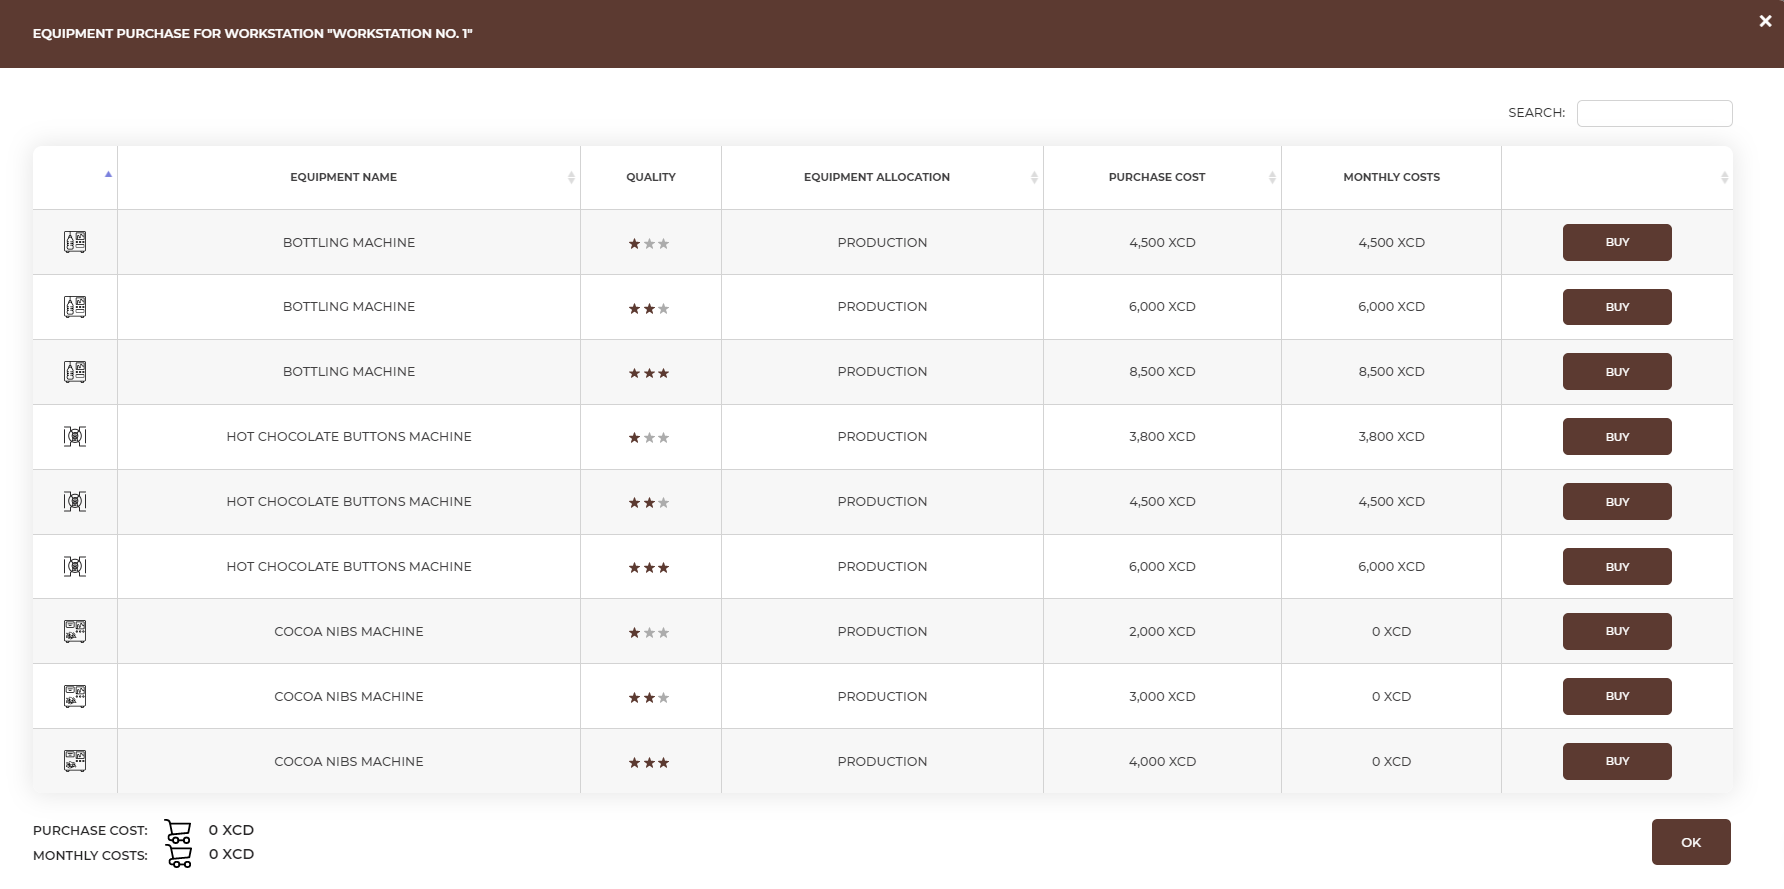
In the Investments – Equipment tab choose the workstation you want to equip and select the necessary equipment choosing appropriate quality level.
|
|
Note that each type of equipment is used either for production or sales. |

|
Equipment quality directly affects employee satisfaction in the scorecard. |
|
|
Equip only the workstations where you will be employing staff. If you purchased extra workstations, leave them empty until you need more employees. |
It’s time to deal with matters related to your employees, i.e. HR (human resources). Decisions in this respect concern mainly the employment and then taking care of employees’ development and good working conditions. You can send your employees to trainings to update their knowledge. You can also invest in amenities that will make their work more pleasant and less burdensome. Proper care of employees will make them happy, and thus they will do their job willingly and well, which in turn will make customers more satisfied and eager to come back to you again. Of course, the personnel management is not just about employing, but you may also need to dismiss your employee because there will not be enough work for them in the company.
You must have a workstation prepared to hire employees. If you have previously purchased a workstation, it will be in the HR tab - employment, shown as an available one, and you can assign a new employee to it.

Choose the workstation where you want to hire an employee to view a list of candidates ready to start working for you.
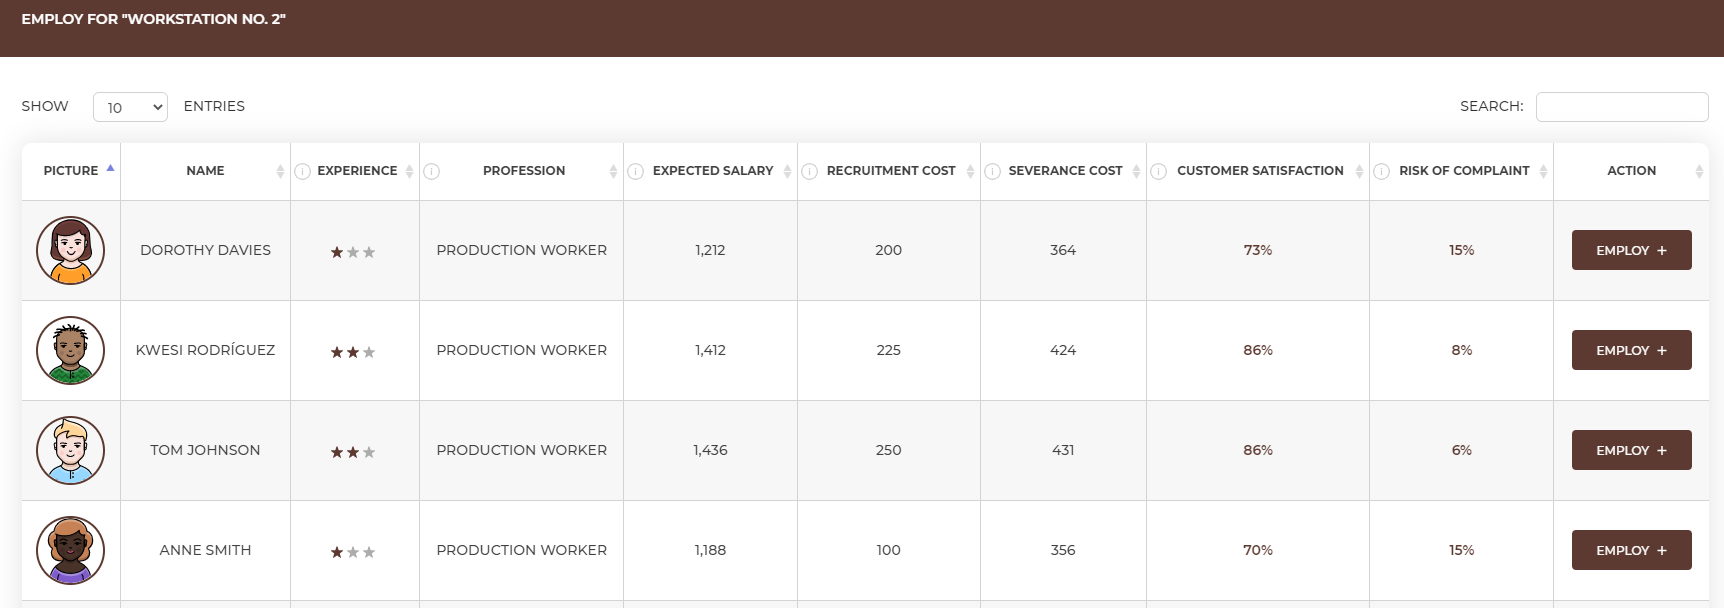
You can learn the following about the candidates:
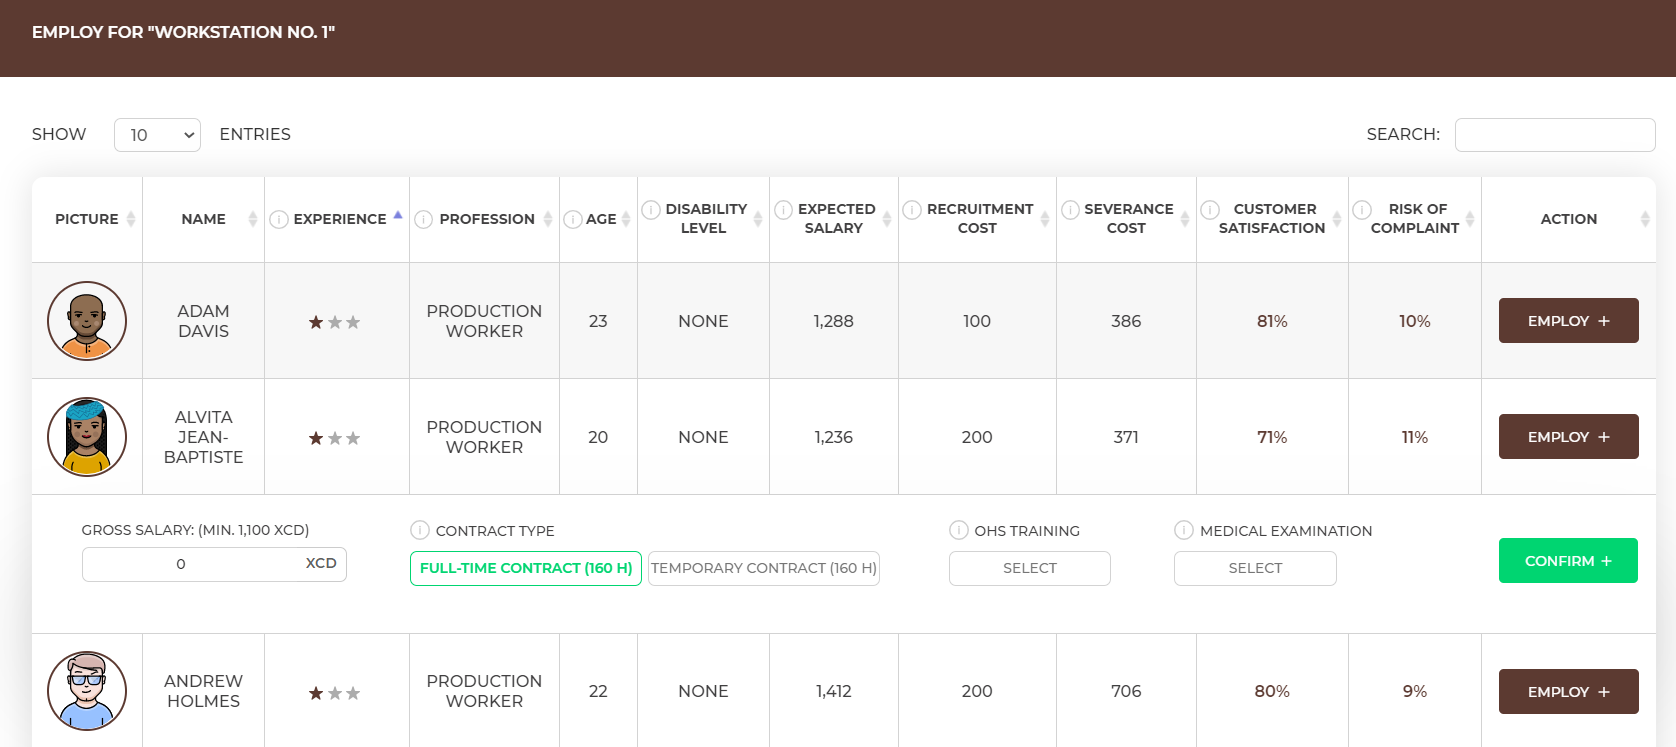
You can hire employees under a full-time or temporary contract. Employees expect a full-time contract, because it provides permanent employment and employee benefits described in the Labour Code such as, e.g. a specific leave. From the point of view of the employer, the full-time contract means higher costs because there is an additional employer's contribution over the agreed salary to be paid. Check the value of the employer's contribution in the Dashboard.
After selecting the right employee, click on the ‘Employ’ button and decide about:
Finally, approve with the ‘Confirm’ button.
|
|
The salary you provide is the gross salary, i.e. it includes the net amount that the employee receives into the account as well as social security contributions and taxes paid by the employee. Moreover, as an employer, you must pay the extra employer's contributions for each full-time contract, so that the actual amount you spend on the salary will be higher than the amount you indicate at the employment. |
|
|
Salary and contract type directly affect employee satisfaction in the scorecard. In the following months employees will also consider if you offer monthly bonuses and how the number of staff change (if you hire or rather dismiss employees). Additionally, experience level of your employees affects customer satisfaction. |
In the following months, once you have employees, you can modify their financial conditions. To make changes, select the profile of the selected employee by clicking on his/her picture in the HR - employment tab.
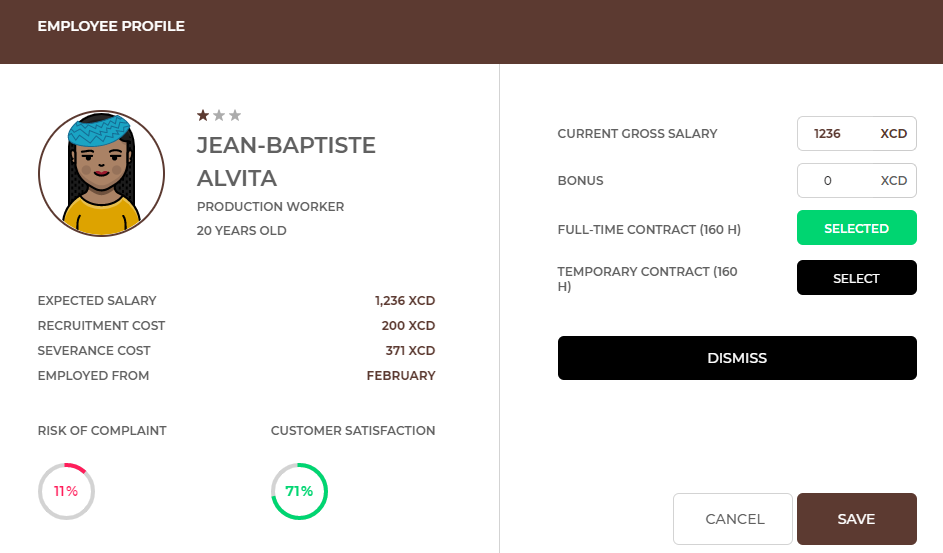
You can check the following employee information in the employee's profile: experience level, risk of failure, customer satisfaction, expected salary, costs of employment and severance, employment date. In each round you can change the monthly salary of an employee and form of his/her employment (from the full-time contract to the temporary contract and vice versa). You can also decide to give the employee a bonus in a given month. The bonus you offer will be paid to the employee once, that month.
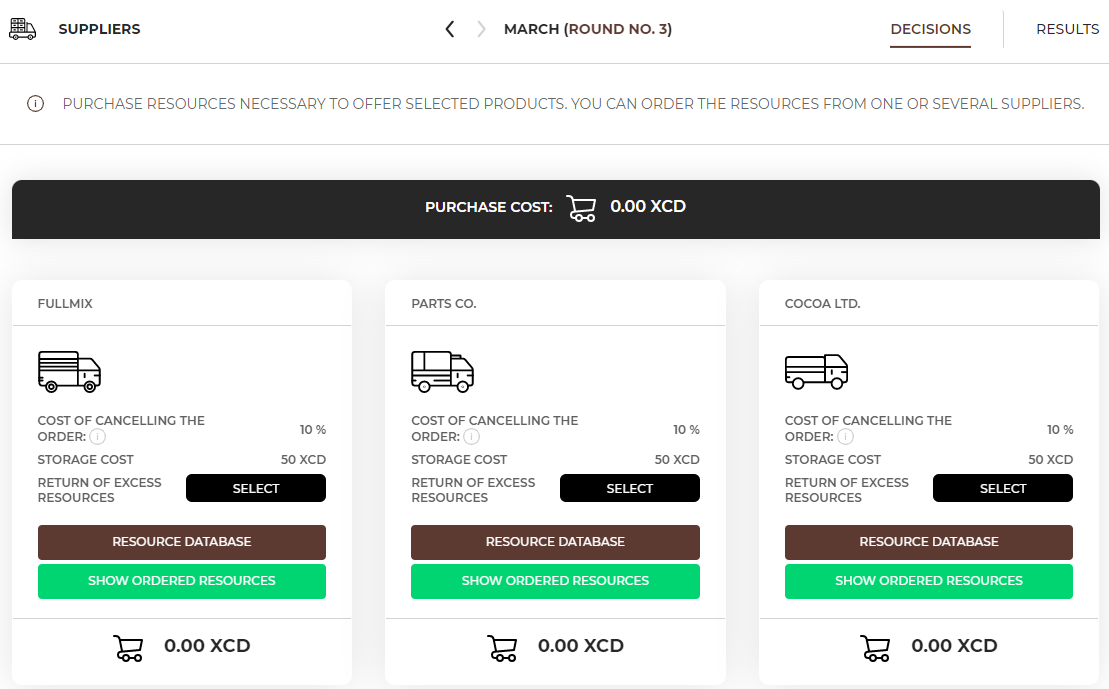
You need the right resources to manufacture the products. You can order them from several suppliers. A list of available companies offering resources can be found in the Suppliers tab. In subsequent rounds you will have more and more suppliers at your disposal. Each of them offers a different price for resources, so you will need to analyse well from whom it is the most profitable to order. Moreover, the suppliers offer resources of different quality (basic (☆), standard (☆☆) and premium (☆☆☆)). The quality of resources affects the quality of the products you sell to customers. The higher the quality of resources, the greater the satisfaction of your customers.
|
|
You do not have to choose one supplier. You can freely modify your order with all suppliers to get the best purchase conditions. |
The amount of resources you need depends on how many products you plan to manufacture. To calculate the number of resources to order, multiply the number of products by the requirement.
|
|
number of resources to order |
= |
forecasted demand (from the Offer tab) |
x |
demand for resources (from the Offer/More details tab) |
|
|
Example |
Let’s analyze the required resources for the Coconut chocolate bar.
In order to find out what you need to purchase from suppliers, first check the required resources in the Offer tab (details button). Then, go to the Suppliers tab, open resource database from any supplier and check how suppliers sell these resources (in single units or maybe in bulk packages).
We forecasted that the demand for this product next month will be 1210 bars. In order to manufacture this product, you need 5 types of resources:
This is how you need to calculate the required resources for all products you want to manufacture.
|
|
To order the resources you will need, select the resource database of one of the supplier, in the Suppliers tab, and then choose the required resources one after another by adding their number. You can buy all resources from one supplier or buy different resources from different suppliers. |
|
|
Quality of the resources directly affects the customer satisfaction in the scorecard. |
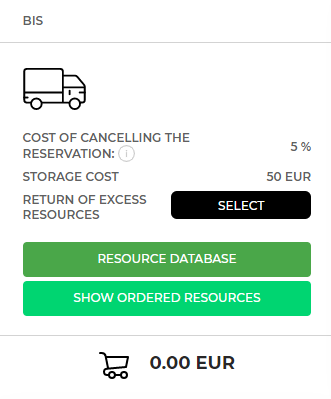
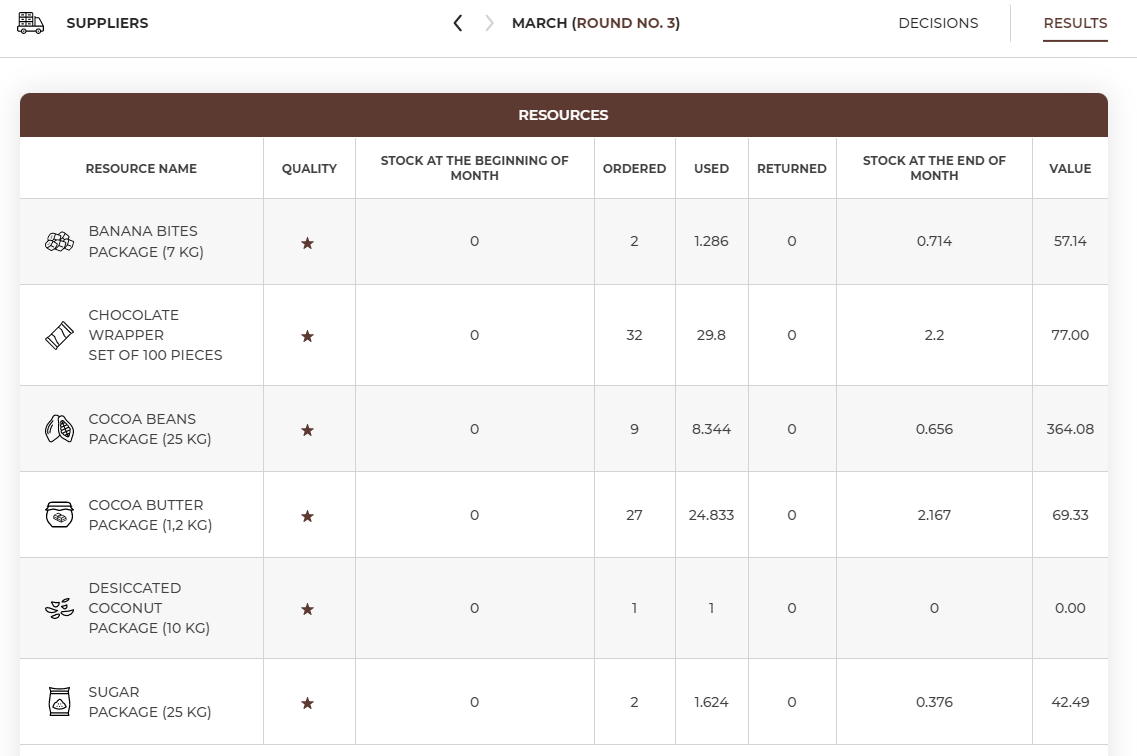
It is possible that your production team will not use up all resources purchased. It can happen e.g. because you purchased more resources than needed or your production workers run out of time and cannot manufacture the planned production volume. In such case you need to decide what to do with the unused resources:
|
|
|
|
You can only return resources that have not been used (unopened/full packages only). If there were 5 items in the package and 1 was used, the other 4 will remain in the storage. All opened packages are automatically stored. |
After selecting all the resources you can check your order. “Show ordered resources” button under your supplier’s name to check your order, modify or delete it.
|
|
After entering the “Show ordered resources” button, you can freely modify your order - delete unnecessarily ordered resources and change the number of resources to buy. |
In the Production tab, choose the production volume for all products that you have decided to offer. In this tab you will find all the products which are available for production (you have the right equipment, employees and resources).
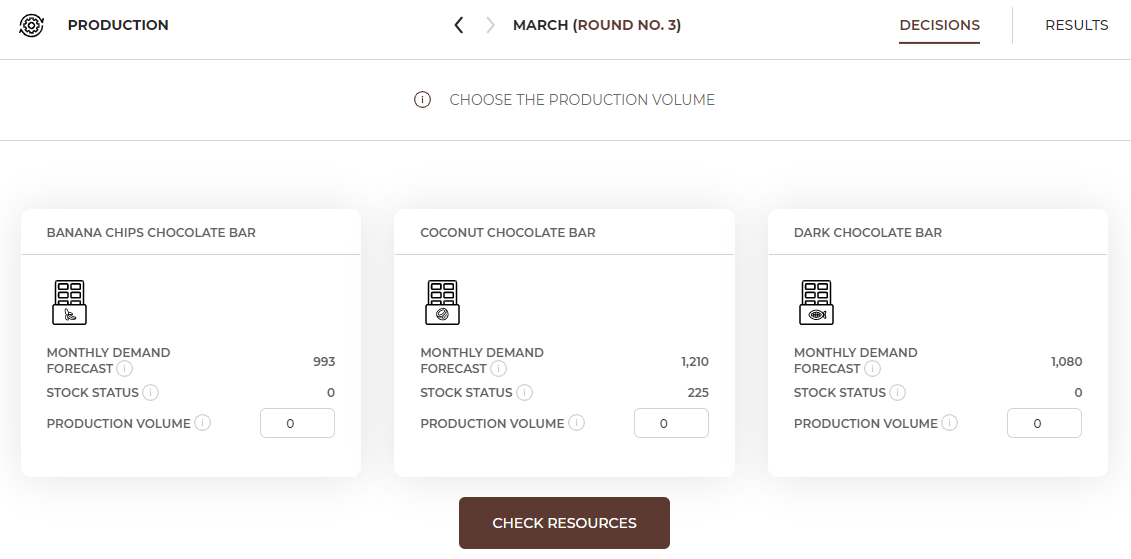
Before you choose the production volume, analyse thoroughly the details you have on the screen:
|
|
At the bottom you will find the "Verify Resources" button, which will allow you to verify if what you have prepared (equipment, employees and resources) is sufficient to produce the chosen volume. If the verification result is negative, recalculate the equipment, employees and resource requirements and get what you lack. |
|
|
If it turns out that you do not have the amount of resources required to produce as many products as you chose in the production volume and you will not buy enough to fill this gap, you will have only as many products manufactured as the resources in stock will allow. |
|
|
If you have a lot of products in stock, it is not necessary to produce more - it is up to you if you want to have more products this month or if you want to have more in stock. |
Let's summarize the offer you have prepared for your customers. In the Sales tab you will find products that are ready for sale in a given month.
|
|
In order for the product to appear in the Sales tab, all requirements from the Offer tab (details of the service) must be met:
|
If you wanted to offer given product to your customers and it has not appeared in the Sales tab, check if you really have all the necessary items. The simulation will help you understand what is missing and therefore what is blocking the possibility of selling all products marked for sale in the Offer tab:

If you wanted to offer given product to your customers and it has not appeared in the Sales tab, check if you really have all the necessary items. The simulation will help you understand what is missing and therefore what is blocking the possibility of selling all products marked for sale in the Offer tab:

|
|
The price of the product directly affects customer satisfaction in the scorecard. |
|
|
Example |
|
|
If the product is not turned on for sale and the price is not set, it will not be offered to the customers. Before you submit decisions, make sure all products are selected and their prices are set. |
In the first round you chose your bank, but you can change it in each round. New offers of banks will appear in subsequent rounds, so it is worth remembering to regularly analyse and compare them with your current account.
In the Bank tab, you can also check your bank account information.
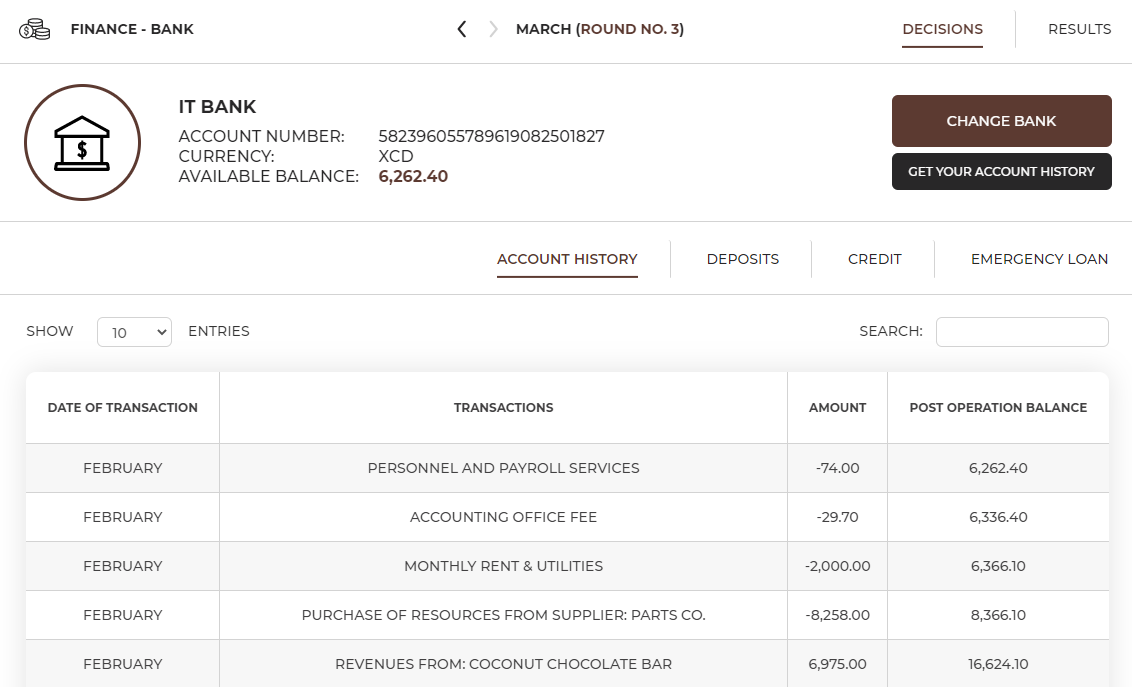
In addition to information about the currently selected bank, you'll find there:
|
|
To start a deposit, click on ‘Create' in the Deposit tab. Then specify the period for which you want to create a deposit (in months) and the amount of funds you want to allocate to the deposit. Please note, the table shows the interest rate on the deposit and the current account balance. You cannot create a deposit for an amount greater than the available balance. After the expiry of the specified period, the deposit will automatically expire and the funds collected will be transferred to your bank account. In each round you can close the deposit before it ends. In this case, you will lose interest and the money will be available on your account in the next round. Remember that funds on deposits cannot be used for current expenses.
|
|
|
To take a credit, click “Take a credit” in the Credits tab. Next, enter the period for which you want to take a credit in the credit window (in months) and the amount needed. Please note, in the table you can find information about the annual interest rate on the credit. After taking the credit the details, i.e. the monthly installment and the total amount that remains to be paid back, is displayed in the Credits tab. In each round, the bank automatically collects funds from your account to pay the monthly installment and interest.
|
You can repay your credit anytime if you have enough money in your bank account (‘Repay’ button).
|
|
Remember that you can plan a new credit if you know that you are to incur large expenses in the current round, for which you may not have enough cash. If, on the other hand, you run out of funds for your current activity (e.g. for paying your employees' salaries), an emergency loan (overdraft) will be automatically granted with a higher interest rate. |
|
|
The emergency loan is taken automatically to ensure your liquidity (the ability to pay current liabilities) when there is no cash to pay all liabilities. It is also paid back automatically in the subsequent rounds if your company generates profits. |
In the first round you chose your accounting office, but you can change it at any time. In subsequent rounds, new offers will appear, so it is worth remembering to regularly analyse them and compare them with the offer you are currently using.
In round 3, you can see the first results of your operations. This is the round in which you should analyse the results and make changes in your decisions.
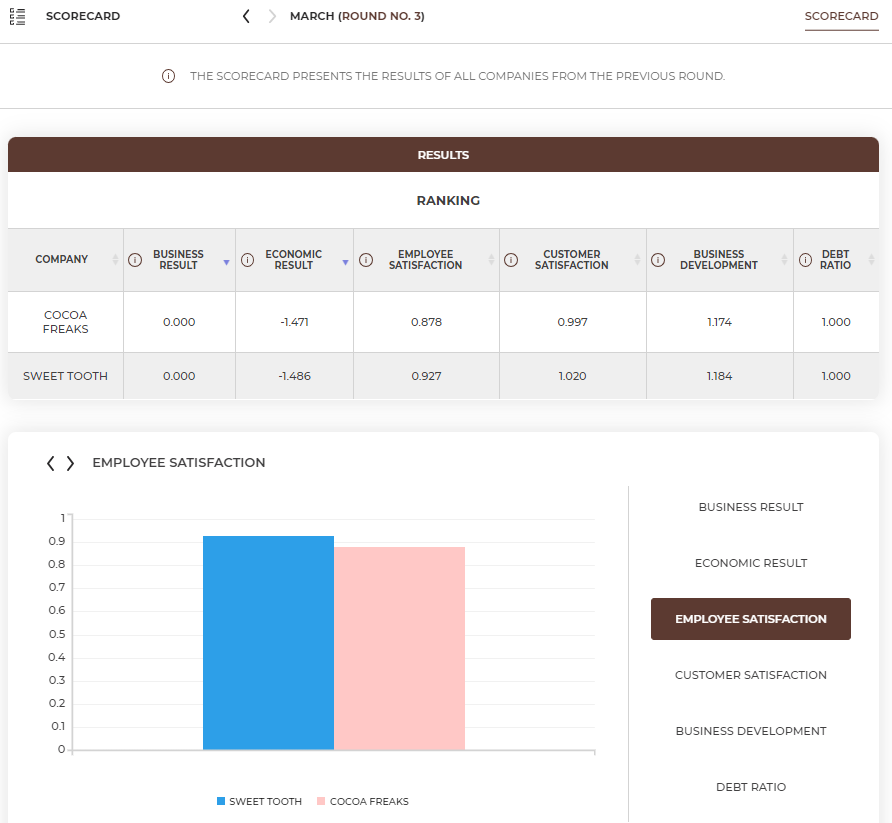
The results in the simulation are presented in the form of a scorecard, evaluating all teams on the basis of 5 ratios dealing with different business aspects, as well as results of all decisions taken in the previous round.
You can find scorecard in the top menu and the results of all your decisions can be found in every tab under ‘Results’.
In the scorecard tab you will find the results of your activity in the previous month (round) compared to all teams in the market.
|
|
The main indicator is the Business result, which is calculated by multiplying the other 5 ratios. |
Theeconomic result assesses the quality of your company in financial terms. It takes into account the financial result and your company value. The higher the ratio, the better your financial results were in the previous month, and if you had a loss in a given round, this indicator will be negative.
|
|
If the economic result is negative, the business result is not calculated (it equals zero). |
Customer satisfaction is the key to building lasting customer relationships and loyalty. Customers mainly pay attention to the price and quality of your products. The prices of products will be compared with the prices of the competition, so if your price is high and is not associated with the quality of products i.e. higher than the quality of other companies, the customers will not be satisfied. The quality of products results from a whole set of factors, including the quality of materials and equipment you use and the experience of the employees you employ. Customers usually do not like waiting in queues, so if they are not served in a given round (lost sales occur), some of them will probably go to the competition. Moreover, customers expect agencies where they can choose from a variety of products. If you offer a variety of products, the satisfaction of people buying your products will increase. Your customers also expect faultless products - if the quality of your products is low, customers will return with complaints, which will translate into their lower satisfaction. Customers will also look at your office and available amenities e.g. if there is any parking space, if they can pay by card or get complimentary drinks or Wi-Fi in the waiting room.
Employee satisfaction is an important element in any company, because a satisfied employee performs their job willingly and well. The employee satisfaction is affected by the form of their employment, salaries and bonuses, as well as the work conditions, i.e. employee amenities, quality of equipment they work on and development opportunities (training). Additionally, employee satisfaction may be affected by the changes in the number of your staff (if you are hiring or dismissing employees).
Thebusiness development illustrates your decisions regarding investments in the expansion of your business. The rule is that in business you cannot stand still, but you must constantly develop. This can be achieved by expanding the scope of your products, as well as all types of investments in the company, e.g. purchase of equipment and amenities, as well as employment of new employees.
Thedebt ratio shows the financing structure of your company. If your company does not take out loans or credits, i.e. it is financed with equity, the indicator will be 1. If you take out a credit or an emergency loan (overdraft), the risk of your business increases and the rate will approach 0, and this will make your business result go down.
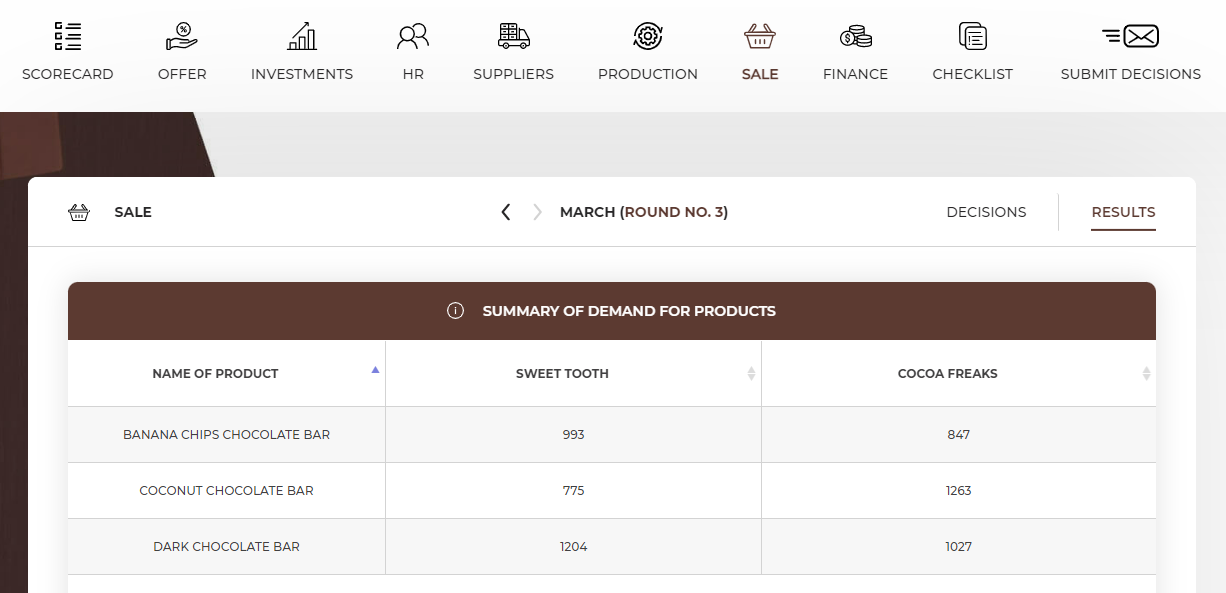
The summary of demand for products graph presents the number of people attracted by your offer in the previous round. Compare your demand with the competition. If more customers chose competitive offers, analyse prices and quality of these offers.
|
|
Example |

|
|
Just because customers came to your company, it does not mean you managed to sell thie product. Your actual sales depend on the supply i.e. the amount of resources and equipment as well as the number of employees available to serve the customers. You can find the information about your sales in the next graphs. |
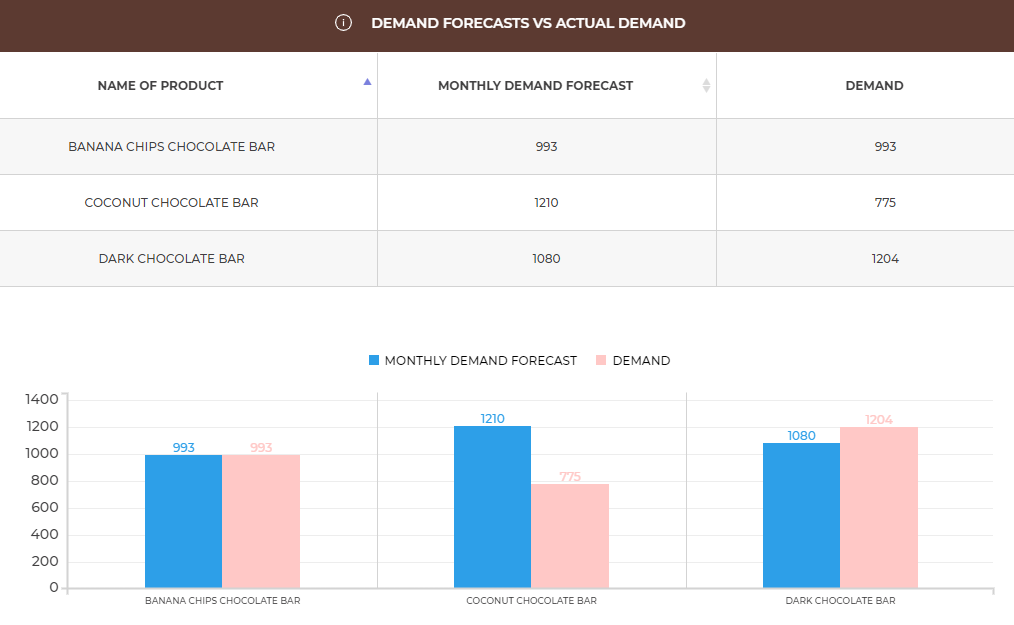
The demand forecast vs actual demand graph compares your demand forecasts from the previous month with the actual number of customers. Demand forecast is the number of customers you were preparing for (monthly demand forecast from the Offer tab) while the demand is the actual number of customers who came to buy your products. Forecasted demand higher than the actual demand may mean e.g. high costs of cancelling the reservation of the resources, so consider how you could attract more customers this month or reduce your forecasts. If, on the other hand, the real demand was higher that the forecasted demand, you probably experienced lost sales, so you may consider increasing your forecasts for the next month.
|
|
Example |
Let’s assume you offer 3 products. Let’s analyse the forecasted and actual demand for 2 of them:
The Sales vs lost sales graph presents the number of customers who came to your company (demand), the number of customers you managed to serve (sales) and the number of customers lost (lost sales) because of insufficient resources like not enough employees, equipment or supplies. Analyse carefully these lost sales (customers who were attracted by your offer but did not get served) and find the reason – employees, equipment or resources.
|
|
Example |

Let’s check the reason for the lost sales. We need to check 3 things:
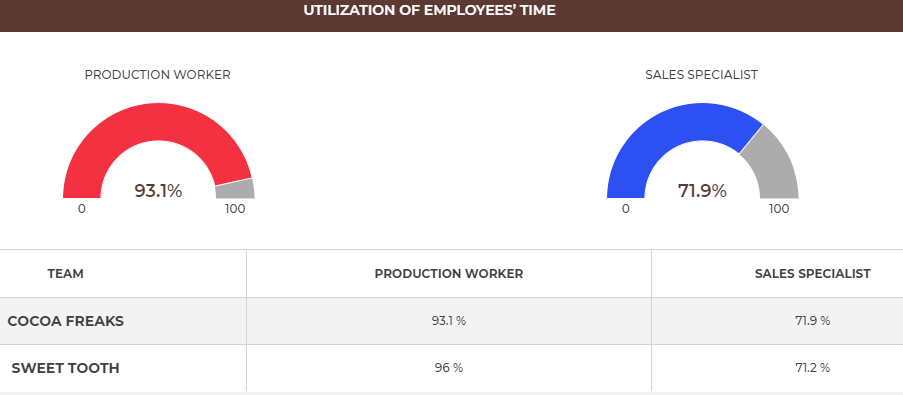 As you can see, the employees were busy a maximum 93,1% of their time, so they still produce and sell more products.
 The equipment was equally busy as the employees, so you could still use it to produce more products with it as well.
 Let’s analyse all purchased resources:
|
|
If you had lost sales for any of the products, check why:
|
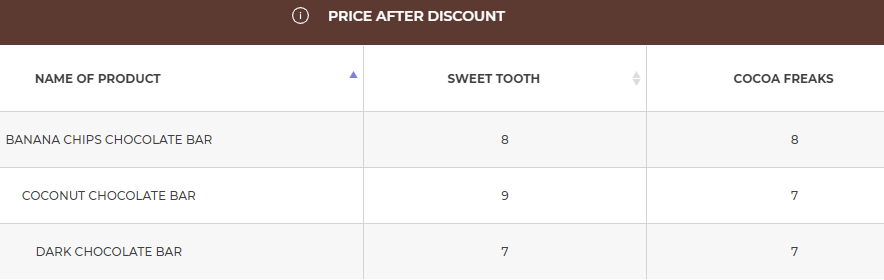
In the table Prices after discount you can analyse your prices against your competitors’ prices. All prices are presented after discounts. The next table will also show you the margins on resources. The next table will also show you the margins on resources.
Cost of complaints graph shows the costs of dealing with all customer complaints about products sold by each employee. Employees you hire have different experience and skills levels that influence the quality of the process of selling the product and, as a result, the number of complaints made by their customers. You will receive a summary of complaint costs for every employee each month.
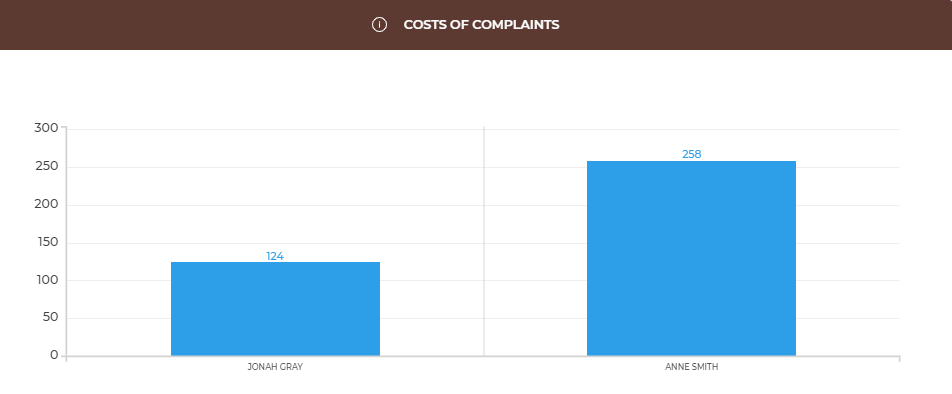
Remember that you can achieve low costs of complaints hiring employees with low ‘risk of complaint’ parameter as well as providing them with a training aimed at improving service quality and therefore also reducing the cost of complaints.
Resources table shows the number of resources bought last round and what happened to them – whether they were used to serve customers or the reservation was cancelled and they were returned to the supplier or left in stock.
Using the Resources quality graph you can compare the quality of your resources with the competition. Put the cursor on the apple-pie chart and select the colour associated with the team you want to check. The graph will then show you how many resources this team bought last round at all quality levels (low, medium, high).
Your duty as an employer is to take care of your employees’ wellbeing and satisfaction. Their level will determine the quality of customer service, and additionally, unhappy employees may decide to quit their job.
You can check the level of satisfaction of your employees every round. It is illustrated with an icon next to the photo of the employee.

Employee satisfaction shows employees’ attitudes towards their tasks. The satisfaction depends on: salary, bonuses, type of contract, change in the number of employees in the company, amenities, equipment quality, trainings and praises. If your employees are unhappy, try motivating them with e.g. a bonus, salary increase or an individual training.
You need to monitor individual employee’s satisfaction regularly as employees unhappy for a longer period of time (3 months) may decide to leave your company.
You can make changes to your employees’ contracts in the employee profile available after clicking on their photo.
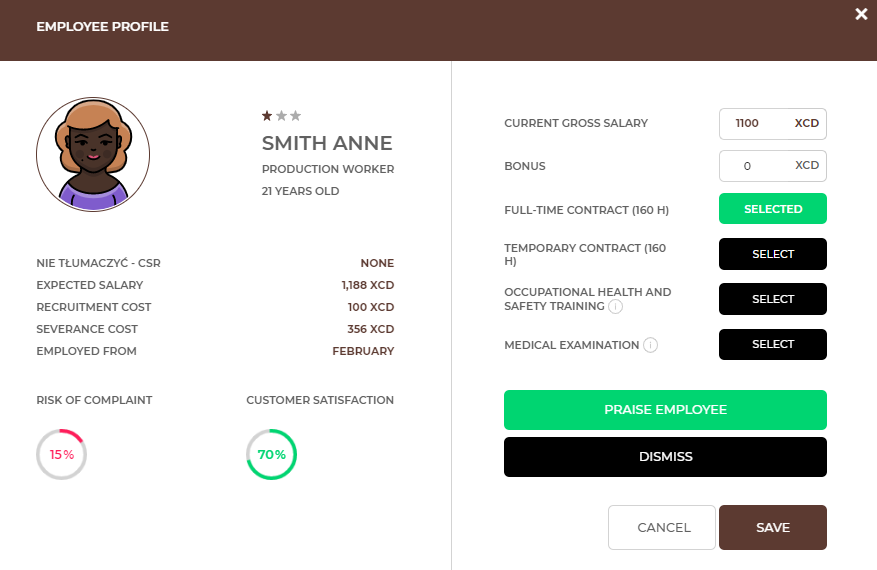
You can check employee’s current status as well as make changes:
Additionally, in the ‘Results’ tab check details about the utilization of time of your employees as well as salaries in the market.
Use the Utilization of employees’ time graph to check how busy your employees were serving the customers last month.
The number of employees graph and table show the number of employees in every team as well as their experience level.
|
|
If your employees are 100% of their time busy, it means they had no time to serve more customers and it could result in lost sales. Also numbers lower than 100% may mean the same – it depends on the number of the sales time hours required to sell the product. |
|
|
Example |
The Average salarygraph shows the basic salary of all teams’ employees. The salary does not include monthly bonuses.
In the Number of equipment items graph you can check how many pieces of equipment each team owned as well as what their quality was (put the cursor over the colour of the selected team to see their results).
Use the Equipment utilization graph to check the use of your equipment in the previous round.
|
|
Just like in the case of employees, if the utilization ratio of your equipment is 100%, it means that it could not have been used to serve 1 more customer and lost sales might have occurred. Also, numbers less than 100% may mean the same – everything depends on the number of sales time hours required to sell a given product. |
In round number 3, all tabs (decisions) are the same as in round 2 and there is one new element - HR - amenities.
Starting from this round you can add products to your offer from the whole products range. In round 3 you can offer up to 6 products.
|
|
The number of products in your portfolio directly affects customer satisfaction in the scorecard. |
If you want to ensure the satisfaction of your employees, provide them with the best working conditions. You can invest in amenities for employees.
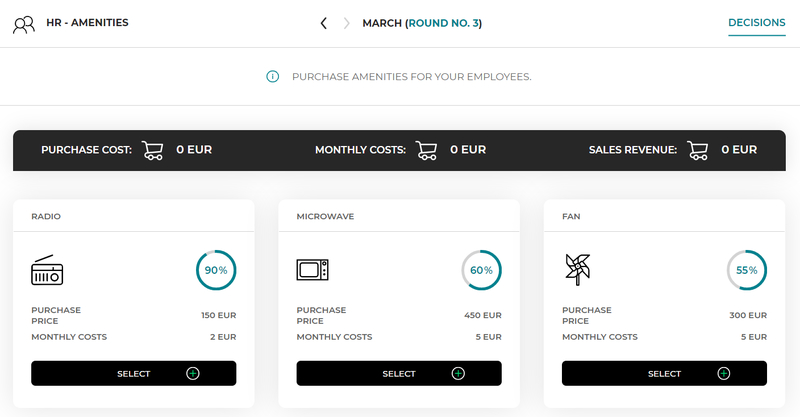
Available information on the amenities for employees:
|
|
To buy the selected amenity, press the “select” button. You can buy any number of amenities for employees in one round. |
At the bottom of the page you can check a summary of the costs associated with the purchase of the selected amenities (purchase costs and monthly maintenance costs).
|
|
The purchased amenity is available in each subsequent round. However, if after some time you decide that you do not need the amenity, you can sell it. To do this, press the “sell” button at the given amenity. The amount of revenues related to the sale of selected devices will be shown at the bottom of the page. |
|
|
The number of amenities directly affects employee satisfaction in the scorecard. |
When you make your business decisions, you can try to make a positive impact on the environment and your local community. Of course, such activities may mean extra costs on the one hand, but will improve your image and scorecard result on the other hand.
Select the programmes and initiatives you would like to launch in your company. They will generate initial costs indicated in the purchase price section and may also generate monthly costs for maintaining them.
In round 4, all tabs (decisions) are the same as in round 3 and there is one extra element - Investments – amenities as well as HR-training. Additionally, there is a new ranking – cumulative scorecard.
In round 4 teams are evaluated with a cumulative scorecard for the first time. It can be found in the Scorecard tab.
Thecumulative scorecard illustrates the situation over the entire period of the company's operations. The values in the cumulative scorecard are calculated as the average of the results of all scorecards for the previous rounds.
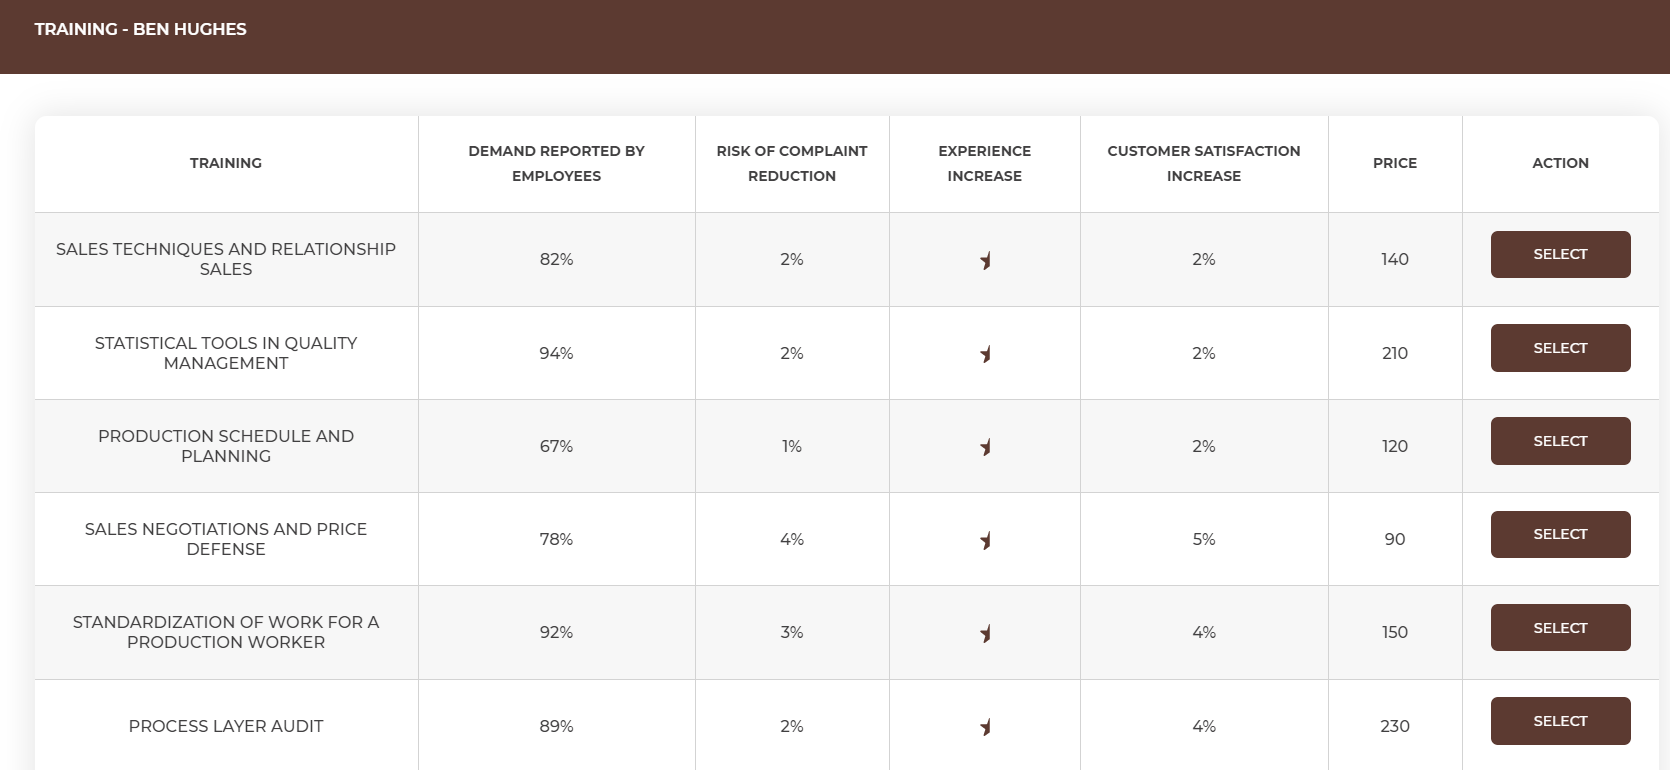
The quality of products to a large extent depends on the experience of your employees. New products are still appearing on the market, so the only way to be 'up to date' is a continuous employee training.
You can invest in training your employees to:
Choose the training for every employee individually according to his/her experience level, satisfaction, and risk of complaint parameter. When you choose the employee, you will see the list of available trainings with the information about their effects.
|
|
You can send every employee to max. 2 trainings per month. |
|
|
Employees take part in afternoon and weekend trainings, so the trainings do not affect the sales and production time available in the month. |
|
|
Training for the employees directly affects employee satisfaction in the scorecard as well as individual characteristic of the employee. |
You can also invest in the equipment of the waiting room, which will make your customers be served in more comfortable conditions, and thus they will be more satisfied with the entire product.
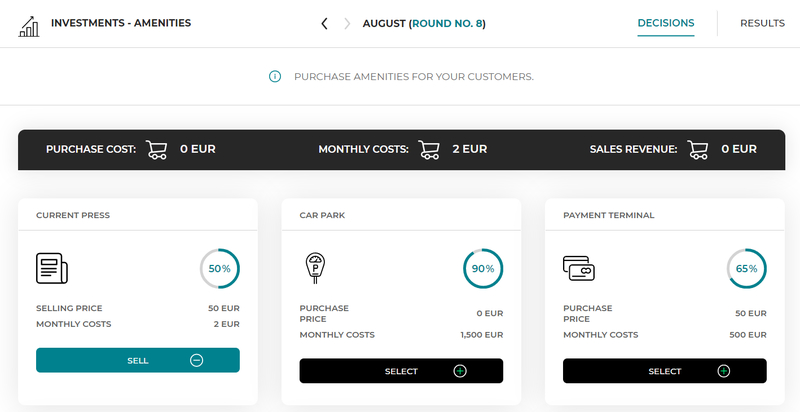
Available information about the waiting room equipment include:
|
|
To buy the selected amenity, press the “select” button. You can buy any number of amenities for employees in one round. |
At the bottom of the page you can check a summary of the costs associated with the purchase of the selected amenities (purchase costs and monthly maintenance costs).
|
|
The purchased amenity is available in each subsequent round. However, if after some time you decide that you do not need it anymore, you can sell it. To do this, press the “sell” button. |
|
|
The number of amenities owned directly affects customer satisfaction in the scorecard. |
In round number 5, all tabs (decisions) are the same as in round 4 and there is one new element – Traditional marketing.
Traditional advertising is billboards, newspapers, radio, television and leaflets. In each of those media you can order the publication/broadcast of your advertisement. One publication/broadcast is, depending on the medium, a one-time display of advertising on TV or radio, a monthly placement on a billboard or the distribution of 1000 leaflets.
|
For each medium, you have the following information available:
|
|
|
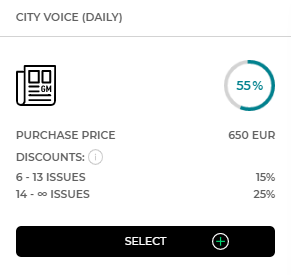
Example |
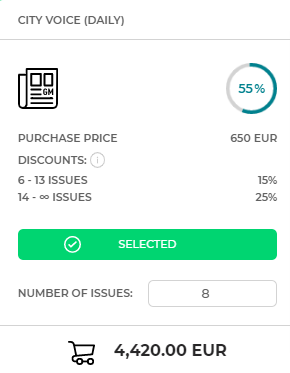
|
Let's assume that you decide to advertise in the City voice daily. The price of one publication is 650 XCD. For orders of over 5 publications, the City voice daily offers a 15% discount (up to 13 publications), and a 25% discount from the 14th publication. When ordering 8 publications, the amount you pay is 4.420 XCD (8 publications 650 XCD each, it costs 5.200 XCD, and after taking into account the 15% discount, 4.420 XCD is paid). |
|
|
|
To order an advertisement in a given medium, press the “select” button and enter the number of publications/broadcasts you want to buy. Next to the cart icon you will receive information on how much the advertisement in this medium will cost you. You can check the summary of the costs of your decisions under each category (press, radio, etc.). |
What are the individual media characterized by?
Billboards are large boards on which posters with advertising content can be placed (traditional billboards) or advertising films can be displayed (LED screens). Buying 1 publication/broadcast means placing your ad on 1 billboard for 1 month. The advantage of billboards is that they reach a relatively large number of people and due to a long exposure (potential customers see the billboard, e.g. every day going to/from work, for a month) make the message be memorized. The disadvantage is that it is not a profiled advertisement - you have no influence on who reads our message and a large information noise (signs, advertisements) on the streets, which causes that some people do not pay attention to roadside advertisements.
Press. You can advertise your business in local newspapers or trade weeklies. Readers of the trade weeklies are people interested in this industry, but those are usually nationwide publications, which means that advertising in them can be less effective, because customers from the other end of the country will not come to you because of the distance. On the other hand, local dailies are addressed to a wide audience, not necessarily interested in your offer, however due to the local nature they will reach potential customers in your region. The publication prices are usually lower in dailies, because the ad appears in 1 publication, and readers usually do not browse the daily newspaper more than once. The offer of weeklies is more expensive; however, it is more likely that the reader will see 1 issue more than once.
Radio. If you choose to advertise on the radio, you have 3 radio stations at your disposal. Each of them covers a different number of listeners. Your advertising spot will be broadcasted the ordered number of times. Remember that advertising on the radio appears at a specific time and reaches the people who are listening to a radio broadcast only at that time, so to obtain a measurable effect it must be broadcasted at least several times.
Television. You can decide to advertise your company on TV. This channel has definitely the biggest audience but also the highest cost of a single issue. Also, just like with radio ads, single ad usually does not produce much effect.
Leaflets.On the local market, you can use leaflets to promote your company. It is a relatively cheap form of promotion. You can also choose the method and place of distribution of leaflets in such a way as to reach the target group. However, it is not possible to ensure that all leaflets will reach potential customers, so again it is necessary to order a larger amount.
In round number 6, all tabs (decisions) are the same as in round 5 and there is one new element – Online Marketing.
Traditional marketing results show which channels were used by your competitors and how much money they spend in total for traditional marketing.
Additionally, Advertising efficiency table and graph will show you how efficient your advertising was. You can check how much the demand for each product increased (how many extra customers came to your company) thanks to advertising in the selected channels.
Nowadays, a large part of promotional activities has moved to the Internet. You have various Internet tools at your disposal - from your own website, through trade portals, a mobile application and social media. Each of them has information about the percentage of your potential customers who use the tools and that you can reach in this way. Moreover, online tools differ in terms of the cost of launching them and their maintenance. Remember that even tools such as Facebook, Instagram or Youtube, require workload for preparing posts, recording and editing movies, etc., although they are free, so if they are to be professionally conducted, some monthly costs will be associated with it.
From round 8, you have all possible decisions to take. Until the end of the game, i.e. round 12, you make decisions within all the available tabs on the menu.